Pages

Wednesday, April 29, 2020

Is Bell Beaker Heritage Associated With COVID-19 Vulnerability?

Map of the Bell Beaker Phenomenon and neighbouring influenced ...

Map of the Bell Beaker Phenomenon 
and neighboring influenced territories from Turek (2016).


As I write this the number of deaths per million people, the most accurate measure available of how hard individual countries have been hit by the COVID-19 pandemic are as set forth below.

One thing that sticks out is that all of the countries with the highest rates of death from COVID-19 per million people have significant levels of ancestry in their populations from people who were members of the Bell Beaker culture of Bronze Age Europe.

While it seems unlikely, that vulnerability to the disease would have such a remote cause, the Bell Beaker culture may have provided these countries with both a shared genetic heritage and a shared cultural heritage, either of which could in some way make these countries more vulnerable to COVID-19 than their counterparts elsewhere in the world.

For example, the death rate from COVID-19 in Finland and Norway, is much lower than that of Denmark, even though all three countries have had similar policy responses to the outbreak (Sweden's elevated death rate can be attributed to its heretical "herd immunity" strategy).

One thing that distinguishes Denmark from Finland and Norway is the Denmark was historically included in the range of the broader Bell Beaker culture for a period of time in the Nordic Bronze Age, while Finland and Norway were not.

Belgium, Spain, Italy (especially Northern Italy that was more hard hit), the United Kingdom, France, the Netherlands, Ireland, Switzerland, Luxembourg, and Portugal all have very significant Bell Beaker heritage. The United States (especially in the hard hit Northeastern United States) and Canada likewise have populations derived in substantial part from these countries. Germany and Denmark, below them, were on the Bell Beaker culture fringe (and I predict, without having ever looked, that Germany's COVID cases are more common in the West than the East of the country, where a Bell Beaker presence was stronger).

UPDATE April 30, 2020 per a user comment:


END UPDATE

Thus, all of the top sixteen countries have significant Bell Beaker ancestry and heritage, except Sweden (whose policy response has been heretical), and Montserrat (which is something of a statistical fluke having one death and a population of 5,900, but might very well have significant Bell Beaker ancestry in its population given that it is part of the British Commonwealth). 

But, of Iran and all other countries with lower death rates, only Austria and Hungary could conceivably have had any notable Bell Beaker connection at all, they are still near the top of the remaining countries, and the Bell Beaker culture impact there was not as dominant, as long lived, or as undisturbed by subsequent European history, as the more severely affected countries in Europe and North America.

Notably, any connection could not be so broad as to include all Indo-Europeans, as areas with heritages associated with the Indo-Iranian or Anatolian or Tocharian language families, or with the Corded Ware culture, have been much less affected.

As I said before, this conjecture is a long shot. But, could there have been some strong selective sweep in Bell Beaker history that left the rest of the world relatively unscathed that was beneficial for the Bell Beaker culture members at the time, but has subsequently left these populations especially vulnerable to COVID-19?

Or, is this a more remote and culturally based connection, associated with the fact that Western European countries and the places that they colonized via population replacement have, for a variety of reasons taken a path of common political and economic development, that has now, for some cultural reason left them especially vulnerable to the pandemic.


Tuesday, April 28, 2020

A Simple Gestalt Analysis Of Large Scale Structure Works Well

The Universe is not homogeneous. It has regions that have dense concentrations of matter and regions that are mostly empty. How did this density structure emerge solely from a fairly simple law of gravity?

This problem was too complicated for N-body simulations and previous analytical approaches that tried to calculate the gravitational force of every object on every other object analytically.

A new paper, managed to summarize a wealth of astronomy observations aimed at that question with a novel mathematical approach that looks at the systems of dense and less dense regions of space as a whole. 

They determined that more matter dense regions grow more quickly, while less matter dense regions grow more slowly, and quantified that simple pattern, in a manner that assume that Newtonian gravitational behavior was dominant. Then, they applied this rule it to a small region of the universe, and extrapolated this to the universe as a whole. 

The end result elegantly explains massive amounts of data with a simple rule that befits a process driven almost entirely by a simple law of gravity.
A 10-year survey of tens of thousands of galaxies made using the Magellan Baade Telescope at Carnegie's Las Campanas Observatory in Chile provided a new approach to answering this fundamental mystery. The results, led by Carnegie's Daniel Kelson, are published in Monthly Notices of the Royal Astronomical Society. 
"How do you describe the indescribable?" asks Kelson. "By taking an entirely new approach to the problem." 
"Our tactic provides new -- and intuitive -- insights into how gravity drove the growth of structure from the universe's earliest times," said co-author Andrew Benson. "This is a direct, observation-based test of one of the pillars of cosmology." 
The Carnegie-Spitzer-IMACS Redshift Survey was designed to study the relationship between galaxy growth and the surrounding environment over the last 9 billion years, when modern galaxies' appearances were defined. 
The first galaxies were formed a few hundred million years after the Big Bang, which started the universe as a hot, murky soup of extremely energetic particles. As this material expanded outward from the initial explosion, it cooled, and the particles coalesced into neutral hydrogen gas. Some patches were denser than others and, eventually, their gravity overcame the universe's outward trajectory and the material collapsed inward, forming the first clumps of structure in the cosmos. 
The density differences that allowed for structures both large and small to form in some places and not in others have been a longstanding topic of fascination. But until now, astronomers' abilities to model how structure grew in the universe over the last 13 billion years faced mathematical limitations. 
"The gravitational interactions occurring between all the particles in the universe are too complex to explain with simple mathematics," Benson said. 
So, astronomers either used mathematical approximations -- which compromised the accuracy of their models -- or large computer simulations that numerically model all the interactions between galaxies, but not all the interactions occurring between all of the particles, which was considered too complicated. 
"A key goal of our survey was to count up the mass present in stars found in an enormous selection of distant galaxies and then use this information to formulate a new approach to understanding how structure formed in the universe," Kelson explained. 
The research team -- which also included Carnegie's Louis Abramson, Shannon Patel, Stephen Shectman, Alan Dressler, Patrick McCarthy, and John S. Mulchaey, as well as Rik Williams, now of Uber Technologies -- demonstrated for the first time that the growth of individual proto-structures can be calculated and then averaged over all of space
Doing this revealed that denser clumps grew faster, and less-dense clumps grew more slowly. 
They were then able to work backward and determine the original distributions and growth rates of the fluctuations in density, which would eventually become the large-scale structures that determined the distributions of galaxies we see today. 
In essence, their work provided a simple, yet accurate, description of why and how density fluctuations grow the way they do in the real universe, as well as in the computational-based work that underpins our understanding of the universe's infancy. 
"And it's just so simple, with a real elegance to it," added Kelson.
From this press release citing an new paper whose abstract and citation are as follows:
A key obstacle to developing a satisfying theory of galaxy evolution is the difficulty in extending analytic descriptions of early structure formation into full non-linearity, the regime in which galaxy growth occurs. Extant techniques, though powerful, are based on approximate numerical methods whose Monte Carlo-like nature hinders intuition building. Here, we develop a new solution to this problem and its empirical validation. We first derive closed-form analytic expectations for the evolution of fixed percentiles in the real-space cosmic density distribution, averaged over representative volumes observers can track cross-sectionally. Using the Lagrangian forms of the fluid equations, we show that percentiles in δ – the density relative to the median – should grow as δ(t)δ0αtβ, where α ≡ 2 and β ≡ 2 for Newtonian gravity at epochs after the overdensities transitioned to non-linear growth. We then use 9.5 square degress of Carnegie-Spitzer-IMACS Redshift Survey data to map galaxy environmental densities over 0.2 < z < 1.5 (∼7 Gyr) and infer α = 1.98 ± 0.04 and β = 2.01 ± 0.11 – consistent with our analytic prediction. These findings – enabled by swapping the Eulerian domain of most work on density growth for a Lagrangian approach to real-space volumetric averages – provide some of the strongest evidence that a lognormal distribution of early density fluctuations indeed decoupled from cosmic expansion to grow through gravitational accretion. They also comprise the first exact, analytic description of the non-linear growth of structure extensible to (arbitrarily) low redshift. We hope these results open the door to new modelling of, and insight-building into, galaxy growth and its diversity in cosmological contexts.
Rik J Williams, et al., "Gravity and the non-linear growth of structure in the Carnegie-Spitzer-IMACS Redshift Survey." 494(2) Monthly Notices of the Royal Astronomical Society 2628-2640 (May 2020) (open access). DOI: 10.1093/mnras/staa100

Monday, April 27, 2020

Finnish Great Winter Myth Partially Validated


Almost every society has a layer of "legendary history" in which the line between fact and fiction is blurred with stories that are on their face impossible in some respect have kernels of reality that undergird them. The Finnish people are not an exception to this rule. 

Recent archaeological work and chemical analysis reveals a time period following a major volcanic eruption that corresponds to "Fimbulwinter," a legendary period with three successive winters (a legend that was probably also an inspiration for the modern fantasy "Game of Thrones" world) and a location the corresponds to the sacred spring containing lakes of Sami legends. Wikipedia explains the legend as follows:
Fimbulwinter is the harsh winter that precedes the end of the world and puts an end to all life on Earth. Fimbulwinter is three successive winters, when snow comes in from all directions, without any intervening summer. Then, there will be innumerable wars. 
The event is described primarily in the Poetic Edda. In the poem Vafþrúðnismál, Odin poses the question to Vafþrúðnir as to who of mankind will survive the Fimbulwinter. Vafþrúðnir responds that Líf and Lífþrasir will survive and that they will live in the forest of Hoddmímis holt.

The mythology might be related to the extreme weather events of 535–536, which resulted in a notable drop in temperature across northern Europe. There have also been several popular ideas about whether the particular piece of mythology has a connection to the climate change that occurred in the Nordic countries at the end of the Nordic Bronze Age from about 650 BC. Before that climate change, the Nordic countries were considerably warmer.
It also bears noting that plagues and famines and major political upheavals and wars often coincide with climate events, with this case again proving that rule.

On a more personal note, the site discussed is quite close to my mother's family's ancestral homeland in Finland.
In the middle of the Levänluhta era, the most severe climate disaster in 2,000 years took place. In the 540s volcanic eruptions initiated a cold and dark period lasting several years, possibly reflected in folktales across the northern hemisphere. Recently the researchers working in the project headed by Oinonen have found a link between the disaster and a reduction in the quantity of light observed in the carbon isotopes found in the annual growth rings of trees in Lapland between 541 and 544. 
"If you want to date Fimbulwinter, the three successive winters mentioned in Scandinavian sagas, this is the best candidate," Oinonen considers. 
Fimbulwinter has been said to have caused a collapse in farming in the areas surrounding Sweden and Estonia. However, the ratio of food from terrestrial sources consumed by the Levänluhta population does not decrease after this period. Instead, the group relying heavily on marine food starts to fade out. The largest group of people continued to supplement their diet with marine food, actually increasing its presence in the human remains buried in the middle of the 7th century. Protein-rich food indicates produce derived from animals, and it appears that, instead of farming, most of the population probably based their sustenance on animal husbandry and hunting. In fact, fur trade has traditionally been thought as the source of wealth during the Iron Age in these southern roots of the Suomenselkä water divide. 
Prior genetic research and place name data indicate a connection between the Levänluhta population and the Sámi. Signs of the diverse livelihoods of Iron Age Sámi have also been previously observed in Sweden on the same latitudes. Indeed, the researchers are considering whether the lake burial site of Levänluhta could be a manifestation of sáivas, the sacred spring-containing lakes in the Sámi mythology.
From here, based upon the following paper: 
Levänluhta is a unique archaeological site with the remains of nearly a hundred Iron Age individuals found from a water burial in Ostrobothnia, Finland. The strongest climatic downturn of the Common Era, resembling the great Fimbulvinter in Norse mythology, hit these people during the 6th century AD.
This study establishes chronological, dietary, and livelihood synthesis on this population based on stable carbon and nitrogen isotopic and radiocarbon analyses on human remains, supported by multidisciplinary evidence. Extraordinarily broad stable isotopic distribution is observed, indicating three subgroups with distinct dietary habits spanning four centuries. This emphasizes the versatile livelihoods practiced at this boundary of marine, freshwater, and terrestrial ecosystems. 
While the impact of the prolonged cold darkness of the 6th century was devastating for European communities relying on cultivation, the broad range of livelihoods provided resilience for the Levänluhta people to overcome the abrupt climatic decline.
Markku Oinonen, et al., "Buried in water, burdened by nature—Resilience carried the Iron Age people through Fimbulvinter." 15(4) PLOS ONE e0231787 (April 21, 2020) (open access). DOI: 10.1371/journal.pone.0231787

The introduction of the paper (citations omitted) provides helpful context:
Mediterranean historical sources identify a mystery cloud obstructing the Sun at AD 536/537. The year without the Sun is observed in tree rings as a negative growth anomaly throughout the Northern Hemisphere (NH). An even larger tree-growth decline is observed during the AD 540s, and discussion of the anomaly has evolved from a single mystery cloud to a decade-scale climatic catastrophe as a result of multiple volcanic eruptions of AD 536–550. The anomalous years probably triggered a longer climatic disturbance lasting until AD 570, or even beyond, known as the “Late Antique Little Ice Age” (henceforth LALIA). This cold and dark period—further stressed by the breakout of the Justinian Plague in AD 542—coincided with the rise and fall of empires, human migrations, and political upheavals. 
The volcanic winter of the AD 540s, recently linked to the Ilopango eruption in El Salvador, featured a drastic reduction of solar irradiance for several years in AD 541–544. This was observed in Northern Finland, reducing the temperature and photosynthetic rate, and thus primary production. The severe effects of distant volcanic eruptions on agricultural communities across the NH have been recently demonstrated—crop losses and famines in 17th century AD Finland have been shown to have resulted from tropical volcanic eruptions. As the AD 536–550 climatic catastrophe was the most severe in the last 2500 years, one can hypothesize that its consequences for communities relying on cultivation were even more catastrophic. Indeed, the abandonment of Iron Age settlements in Scandinavia and Estonia after AD 550 may have been a result of the climatic downturn and cultivational challenges. 
This work studies the dietary habits and livelihoods of a population that experienced the AD 536–550 climatic downturn in Southern Ostrobothnia, Finland. Early scholars only fragmentarily tell of the people of the North, and these frontiers of ancient civilizations have remained a kind of an unknown otherworld, associated with mystical elements of the seasonal change from long darkness to midnight sun. However, already paralleling the early civilizations of the Mediterranean, the Northerners were involved in cultural connections and trading networks across the Europe, linking them to the world system. In the Southern Ostrobothnian inland, nearly a hundred Iron Age (ca. AD 300–800) individuals were buried in water in Levänluhta. The site, presently consisting of three springs releasing red iron-containing water, has been one of the most intriguing archaeological mysteries within Finland. The lives of these people coincided with the greatest global-scale changes of the Common Era: a land uplift of one meter per century and an abrupt period without the Sun. Using dietary stable isotope studies combined with chronological analyses on human bone collagen samples, it is possible to understand the factors that allowed the Iron Age populations at the northern edge of European civilization to carry themselves through these challenges. A synthesis of this watery burial of worldwide uniqueness is established by tying the existing multidisciplinary knowledge together.
Another analysis of the same event can be found here

Thursday, April 23, 2020

Neanderthals Went Extinct Due To Modern Human Competition

Various climate factors put Neanderthals in a vulnerable position during the Upper Paleolithic era when modern humans began to intrude into their European territory. But, ultimately, the ability of modern humans to exploit more diverse and marginal sources of food that Neanderthals who had a stronger big game emphasis in their diet, allowed modern humans to prevail in their competition with Neanderthals. This drove the Neanderthals to their extinction.
Anatomically Modern Humans are the sole survivor of a group of hominins that inhabited our planet during the last ice age and that included, among others, Homo neanderthalensis, Homo denisova, and Homo erectus. Whether previous hominin extinctions were triggered by external factors, such as abrupt climate change, volcanic eruptions or whether competition and interbreeding played major roles in their demise still remains unresolved. Here I present a spatially resolved numerical hominin dispersal model (HDM) with empirically constrained key parameters that simulates the migration and interaction of Anatomically Modern Humans and Neanderthals in the rapidly varying climatic environment of the last ice age. The model simulations document that rapid temperature and vegetation changes associated with Dansgaard-Oeschger events were not major drivers of global Neanderthal extinction between 50-35 thousand years ago, but played important roles regionally, in particular over northern Europe. According to a series of parameter sensitivity experiments conducted with the HDM, a realistic extinction of the Neanderthal population can only be simulated when Homo sapiens is chosen to be considerably more effective in exploiting scarce glacial food resources as compared to Neanderthals.
Axel Timmermann, "Quantifying the potential causes of Neanderthal extinction: abrupt climate change versus competition and interbreeding" bioRxiv (April 20, 2020). doi: https://doi.org/10.1101/2020.04.19.049734

The Limits Of Civil Engineering In The Ancient Andes

Civil engineers can do a lot, but for these ancients, the Y1K megadrought that they faced was more than they could handle. 
When colonists from the Wari state arrived in the remote Moquegua Valley in southern Peru, they built their towns on high, dry land and erected canals and aqueducts that carried water much farther than any previously attempted in the region. Such innovative hydraulic engineering enabled Wari—which some scholars argue was South America's first empire—to expand and thrive for some 400 years despite an often dry, drought-prone climate. But archaeologists studying Wari's rise and fall confront a puzzle. The state's collapse about 1000 years ago appears to have coincided with a severe drought. How could drought have doomed a society that had been built on learning to take maximum advantage of limited water?
Lizze Wade, "Engineering an empire" 368 (6488) Science 234-237 (April 17, 2020). DOI: 10.1126/science.368.6488.234

Sea Level Rise Ca. 14,650 Years Ago

The Bølling warming event opened the gates from Beringia to North and South America by melting North American glaciers. At this point the Founding population of the Americas rapidly filled it in a mass migration into virgin territory. Across the pond in Europe, this event gave rise to the Mesolithic repopulation of Europe from several Southern refugia. This climate event also caused sea levels to surge in 500 years. As a popular account explains:
Earth's last Glacial Maximum period began around 33,000 years ago, when vast ice sheets covered much of the Northern Hemisphere.  At the time, the Eurasian ice sheet -- which covered much of Scandinavia -- contained approximately three times the amount of frozen water held in the modern-day Greenland ice sheet. 
But rapid regional warming saw the ice sheet collapse over a period of just 500 years, according to authors of the study published in Nature Geoscience.  
Analysing sediment drill cores from the Norwegian Sea, the team found that the ice sheet's collapse contributed to an event known as Meltwater 1A -- a period that saw as much as 25 metres added to global sea levels between 13,500-14,700 years ago. 
Lead author Jo Brendryen from Norway's University of Bergen said the Eurasian ice sheet melt coincided with vast regional temperature swings.  
"Studies of ice cores drilled from the Greenland ice sheet have suggested that the atmosphere above Greenland warmed by up to 14C in a few decades at this time," he told AFP. "We think that this warming was the main driver of the ice sheet collapse." 
While Earth is heating everywhere, parts of the world such as the poles are warming far faster than others. Atmospheric concentrations of planet-warming CO2 were around 240 parts per million at the time, compared with over 415 ppm currently.  
The Greenland ice sheet, which contains enough frozen water to lift global sea levels more than six metres, is currently melting at record rates, losing more than 560 billion tonnes of mass in 2019 alone. Parts of Greenland and Antarctica are now melting six times faster than they were in 1990. 
The study showed that the entire Eurasian ice sheet melted in a matter of a few centuries, adding more than four centimetres to sea levels annually -- around 4.5-7.9 metres in total. 
Ice sheets melting or breaking away as global temperatures rise are subject to what climate scientists term temperature "tipping points". Many researchers fear that the ice sheets in Greenland and West Antarctica will continue to melt even if warming is slowed as carbon emissions are cut.  
"Our research support this idea as the marine based sectors of the Eurasian ice sheet abruptly disappeared and did not grow back," said Brendryen.  
"Where the exact tipping-points are located, both for the past ice sheets and the current ice sheets in Greenland and Antarctica, remain however unknown."
The paper and it's abstract are as follows:

Rapid sea-level rise caused by the collapse of large ice sheets is a threat to human societies. In the last deglacial period, the rate of global sea-level rise peaked at more than 4 cm yr−1 during Meltwater Pulse 1A, which coincided with the Bølling warming event some 14,650 years ago. However, the sources of the meltwater have proven elusive, and the contribution from Eurasian ice sheets has been considered negligible. 
Here, we present a regional carbon-14 calibration curve for the Norwegian Sea and recalibrate marine 14C dates linked to the Eurasian Ice Sheet retreat. We find that marine-based sectors of the Eurasian Ice Sheet collapsed at the Bølling transition and lost an ice volume of 4.5–7.9 m sea-level equivalents (SLE) over 500 years. During peak melting, 3.3–6.7 m SLE of ice was lost, potentially explaining up to half of Meltwater Pulse 1A. A mean meltwater flux of 0.2 Sv over 300 years was injected into the Norwegian Sea and the Arctic Ocean at a time when proxy evidence suggests vigorous Atlantic meridional overturning circulation. Our reconstruction shows that massive marine-based ice sheets can collapse in as little as 300–500 years.
Brendryen, J., Haflidason, H., Yokoyama, Y. et al. "Eurasian Ice Sheet collapse was a major source of Meltwater Pulse 1A 14,600 years ago." Nat. Geosci. (2020). https://doi.org/10.1038/s41561-020-0567-4 

Related commentary in the same issue here.

Tuesday, April 21, 2020

Samoan Population History

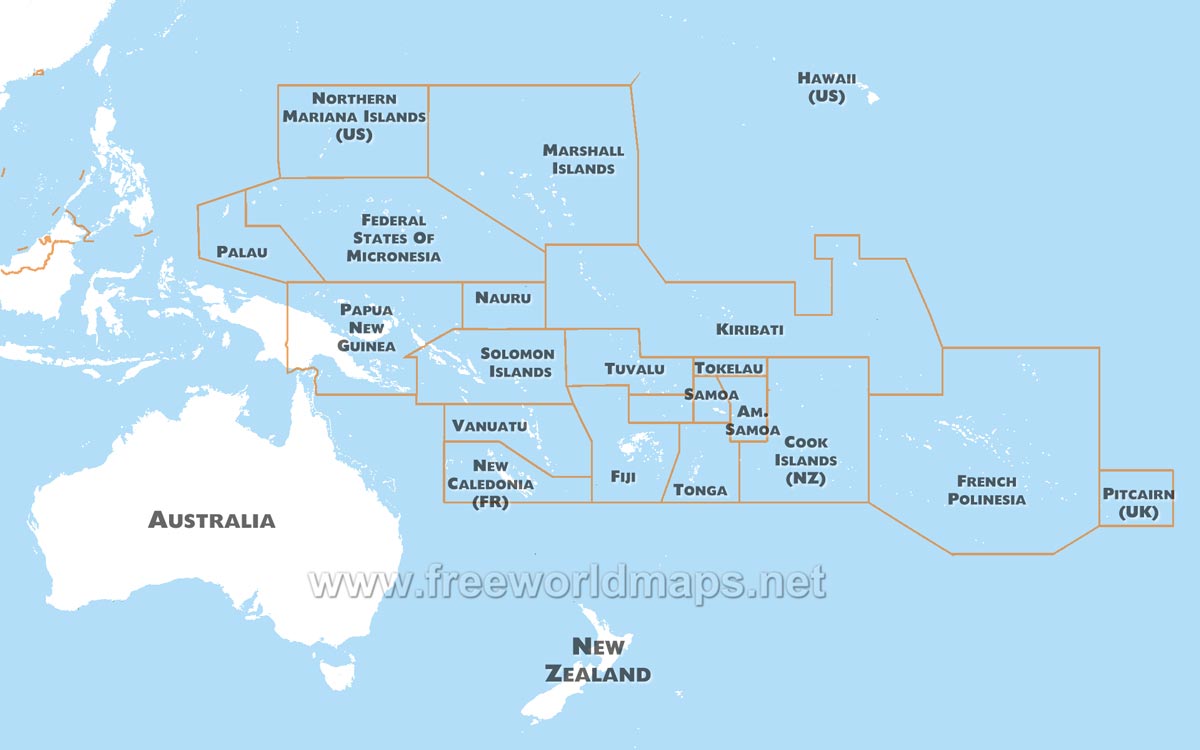
Oceania Maps – Freeworldmaps.net


A new study looked a modern genomes from a significant share of the entire population of Samoa (which has a total population of 246,000 people now), an Oceanian island in the Pacific Ocean, and inferred a great deal of past population history from the sample. 
A new study in Proceedings of the National Academy of Sciences analyzed the genomes of 1,197 individuals in Samoa and found that the effective population size of the first Samoans was small -- ranging from 700 to 3,400 people during the time period from approximately 3,000 to about 1,000 years ago. Starting about 1,000 years ago, population size rapidly increase to about 10,000 individuals, coinciding with increasing agricultural and socio-political complexity, but also with previously hypothesized contacts with other Oceanic peoples. 
This population history scenario for Samoa is consistent with the existing archaeological evidence of few, widely scattered and small-sized settlements in the first 2,000 years after Samoa's initial settlement. But it contrasts with archaeological population reconstructions of much larger population sizes for adjacent Pacific peoples in Tonga and Fiji during that first 1,500 to 2,000 years after initial discoveries around 3,000 years ago. . . . 
The new study also found that modern Samoans derive largely from the Austronesian lineage, including the aboriginal peoples of Taiwan, Island Southeast Asia, coastal New Guinea and other island groups of Oceania -- but share 24% of their ancestry with Papuans, the descendants of the people who settled Papua/New Guinea, an estimate markedly lower than found in neighboring Polynesian groups. 
The researchers also found strong evidence of population reduction coincident with outside contact from European-derived groups, presumably from infectious diseases new to Samoan immune systems and societal shocks from such epidemics. The whole genome sequence data from participants' DNA also enabled findings about some genetic diversification within Samoa that may be reflective of regional and local social processes. The genomic data also showed an increase in population size about 150 years ago.
This summary of the archaeology and history of Samoa 
is from the Supplemental Materials (Table S5).

It isn't entirely clear what happened around Y1K (i.e. 1000 CE) to fuel a sudden burst of population growth after two thousand years of modest populations, although the introduction of the kumara, a species of sweet potato native to South America that made it way from the Pacific coast of South America to Easter Island and eventually all of the way to New Zealand, possibly with other technologies from other islands in Polynesia, around this time, could be a plausible explanation. As Wikipedia explains at the link above in a well annotated account:
The origin and domestication of sweet potato occurred in either Central or South America. In Central America, domesticated sweet potatoes were present at least 5,000 years ago, with the origin of I. batatas possibly between the Yucatán Peninsula of Mexico and the mouth of the Orinoco River in Venezuela. The cultigen was most likely spread by local people to the Caribbean and South America by 2500 BCE. 
The sweet potato was grown in Polynesia before western exploration as the Ipomoea batatas, which is generally spread by vine cuttings rather than by seeds. Sweet potato has been radiocarbon-dated in the Cook Islands to 1400 CE. A common hypothesis is that a vine cutting was brought to central Polynesia by Polynesians who had traveled to South America and back, and spread from there across Polynesia to Easter Island, Hawaii and New Zealand. 
Pre-Columbian chicken bone ancient DNA from Chile suggests that the exchange of foodstuffs went in both directions. Pre-Columbian Polynesian contact with South America dates to sometime in the vicinity of 800 CE to 1200 CE, well in line with the Samoa demographic event.

The body text of the paper provides some further detail about this transition:
Since the ADMIXTURE analysis likely combined the expected Papuan ancestry in Samoans with the Samoan/Austronesian cluster, we used the D statistic to confirm the presence of Papuan ancestry in Samoans. The f4-ratio estimates of Papuan ancestry proportions indicate that Samoans have an average of 24.36% Papuan ancestry, similar to a smaller sampling of Samoan genomes. Furthermore, the Papuan ancestry is uniformly distributed among Samoans (SD = 0.04852), which could indicate that this admixture occurred prior to the peopling of Samoa. However, we cannot reject a scenario of multiple pulses of Papuan admixture with these data. We also find that this Papuan ancestry is correlated to Denisovan ancestry and not Neanderthal ancestry, which suggests that Denisovan ancestry was introduced to Samoans through Papuan admixture, as previously proposed. 
Samoans have less Papuan admixture (estimated through f4 ratio) than the other Polynesian (Tongans) and Polynesian outlier (Ontong_Java, RenBel, and Tikopia) populations in our dataset, which collectively have an average of 35.38% Papuan ancestry. Recent findings suggest that the second wave of Papuan admixture (50 to 80 generations ago, which is 1,500 to 2,400 y ago) into Remote Oceania occurred after Tonga and Samoa were founded by Lapita pottery populations. Therefore, it is likely that the magnitude of this pulse was not equal across the Lapita region of Remote Oceania. . . . 
Our estimates show that a greater period of growth began at about 30 to 35 generations ago (900 to 1,050 y ago), and the two islands’ Ne histories diverge while also increasing to over 10,000 individuals. This occurs during the same timeframe as the widespread appearance of surface architecture and landscape modification, much of it likely for agriculture, and is consistent with the presumed origins of complex chiefdoms. 
It is significant that Addison and Matisoo-Smith hypothesized a population migration into Samoa about 1,500 to 2,000 y ago (50 to 67 generations ago), possibly through the Micronesian Caroline Islands, that closely precedes the increase in Samoan Ne that we report here. Other important cultural changes are reported to have occurred around this time as well, including the loss of pottery 1,000 to 1,500 y ago (33 to 50 generations ago), the growth of Samoan settlements 500 to 1,000 y ago (17 to 33 generations ago), and the colonization of East Polynesia and the Polynesian outliers from Samoa and Tonga 800 to 1,000 y ago (27 to 33 generations ago). 
The divergence and increase in Ne that we identify might be due to the arrival of a new population in Samoa that admixed with and potentially replaced the initial founding population, although this would be an extreme hypothesis. In the case of a nonabsolute admixture, the IBDNe results would constitute a weighted average of these two populations. This case also implies that the potential incoming population was already admixed with Papuan individuals as the uniformity of the current distribution of Papuan ancestry proportion in Samoans implies a founder population with ∼25% Papuan and 75% Austronesian ancestry.

There are numerous questions posed by archaeological research about Samoa’s early history, which include a potential population replacement between 1,500 and 2,000 y ago. Our results use genetic data to enter this discussion of Samoan history, and support a potential population replacement by identifying the divergence of SAV and Upolu between 30 and 35 generations ago (900 to 1,050 y ago), and a subsequent period of growth. In addition, our results reflect a small growth period beginning at 100 generations ago (3,000 y ago) and then, a low Ne that persisted for about 70 generations (2,100 y) thereafter. This is consistent with archaeological findings supporting a Lapita founding event and a small early population size. However, if there was a complete population replacement, then the Ne history before 30 to 35 generations ago (900 to 1,050 y ago) represents the new incoming population’s history of that time period and not the history of the original Lapita population. Without ancient DNA evidence, we cannot definitively conclude that there was a population replacement or whether some other event caused the increase in population size that we detect. However, we can state that there was a clear demographic change 30 to 35 generations ago (900 to 1,050 y ago) that initiated a period of exponential growth after a long and severe bottleneck. Accordingly, a complete population replacement would be more difficult if there was an existing large population on Samoa before this point.
An infusion of migrants from islands in Oceania that admixed with native Samoans is suggested as a possibility, but the comparatively low proportion of Papuan admixture in Samoans relative to people on nearby islands which probably reached current levels before the Samoan demographic event suggests several plausible possibilities: (1) cultural diffusion of technologies rather than demic change was the main force behind the demic event, (2) the migrants were an atypical population in terms of Papuan admixture resulting in a Founder effect, or (3) the pre-demographic event Samoans had an even lower Papuan admixture level prior to the demographic event that diluted the Papuan admixture percentages which was then equalized through panmixia of the migrants with indigenous people after the demographic event. 

But, another data point suggests that the third option is probably the correct one, because we know from ancient DNA that Papuan ancestry arrived in not too distant Tonga and Vanuatu around 500 CE, which is before the demographic event in Samoa, but long after Samoa was settled, and before that time, Oceanians were purely Austronesian genetically. As I explained in an October 12, 2016 post at this blog (quoting someone else's summary of the process using a study that underestimated the percentage of Papuan ancestry in Tongans).
Polynesians are mostly descended from a population on Taiwan, represented today by Taiwanese aboriginals, and from a Melanesian population similar to New Guinea or the Solomon Islands. They’re about 25% Melanesian autosomally, 6% Melanesian in mtDNA, 65% Melanesian in Y-chromosomes. . . . 
Now they’ve looked at ancient DNA from Tonga and Vanuatu. The old samples don’t have any noticeable amount of Melanesian ancestry. So it was like this: the Lapita derived from Taiwan (thru the Philippines), settled Vanuatua and Tonga – then were conquered by some set of Melanesian men, who killed most of the local men and scooped up the women. Probably their sons extended the process, which resulted in a lower percentage of Melanesian ancestry while keeping the Y-chromosomes mostly Melanesian.  
After this conquest, the Polynesians expanded further east, and those later settlement (Tahiti, Marquesas, Hawaii, etc) all had that ~25% Melanesian component.  
From here.

I noted in that post that: "A rough look at the numbers fits that scenario, with perhaps 44% of the men and 6% of the women in the first generation of conquest being Melanesian, leaving 21% of the Y-DNA mix to come from descendants of the original men (just about half of the original percentage of Melanesian men)."

Together with the data above, we can infer that the ancestry of the modern Samoan population was not completely replaced and instead is derived about 31% from the original first wave Lapita migrants who arrived around 800 BCE, and about 69% of Polynesian migrants who arrived around 950 CE to 1100 CE. This may be an overestimate of the relative proportions of Samoan and non-Samoan ancestry at the time of the admixture event itself, however. 

It could be the some Papuan ancestry could have arrived through population exchange after the initial demographic event and even into modern times, which could help explain why the Samoan language and indigenous population were not overwhelmed and obliterated. It could also be that cultural diffusion spurred the demographic event, and that admixture from Tonga came just a little later, around its traditionally assumed historic date of about 1150 CE.

This possibility of an extended period of immigration into modern times is suggested by a comparison of ancestry percentages between regions within Samoa as show below in the following table from the Supplemental Materials:


We can also infer that the Samoans spoke a language close to the original Austronesian language of one of the indigenous populations of Taiwan albeit with drift over time, that the Melanesian men who arrived in Tonga and Vanuatu around 500 CE ended up adopting the Austronesian language of the people they conquered abandoning their own Papuan language, and that when they migrated to Samoa, the two Austronesian languages, separated by about 1300 years of language drift, either gave rise to the modern Samoan language, or one or the other of those languages became predominant. Linguistic data suggest that the original Samoan language was the linguistic parent language of modern Samoan, but that there were a significant number of Tongan loan words even in basic vocabulary that were integrated into the Samoan language at the time of the demographic transition:
Samoan is an analytic, isolating language and a member of the Austronesian family, and more specifically the Samoic branch of the Polynesian subphylum. It is closely related to other Polynesian languages with many shared cognate words such as aliʻi, ʻava, atua, tapu and numerals as well as in the name of gods in mythology
Linguists differ somewhat on the way they classify Samoan in relation to the other Polynesian languages. The "traditional" classification, based on shared innovations in grammar and vocabulary, places Samoan with Tokelauan, the Polynesian outlier languages and the languages of Eastern Polynesia, which include Rapanui, Māori, Tahitian and Hawaiian. Nuclear Polynesian and Tongic (the languages of Tonga and Niue) are the major subdivisions of Polynesian under this analysis. A revision by Marck reinterpreted the relationships among Samoan and the outlier languages. In 2008 an analysis, of basic vocabulary only, from the Austronesian Basic Vocabulary Database is contradictory in that while in part it suggests that Tongan and Samoan form a subgroup, the old subgroups Tongic and Nuclear Polynesian are still included in the classification search of the database itself.
See also here.

The linguistic data also favor a narrative of the demographic transition ca. 1000 CE in Samoa that is more peaceful than the bloody story of conquest that probably explains the demographic event that brought Papuan ancestry to Polynesia. Otherwise, Samoan would be unambiguously Tongan.

The paper is with its abstract are as follows:
Archaeological studies estimate the initial settlement of Samoa at 2,750 to 2,880 y ago and identify only limited settlement and human modification to the landscape until about 1,000 to 1,500 y ago. At this point, a complex history of migration is thought to have begun with the arrival of people sharing ancestry with Near Oceanic groups (i.e., Austronesian-speaking and Papuan-speaking groups), and was then followed by the arrival of non-Oceanic groups during European colonialism. However, the specifics of this peopling are not entirely clear from the archaeological and anthropological records, and is therefore a focus of continued debate. 
To shed additional light on the Samoan population history that this peopling reflects, we employ a population genetic approach to analyze 1,197 Samoan high-coverage whole genomes. We identify population splits between the major Samoan islands and detect asymmetrical gene flow to the capital city. We also find an extreme bottleneck until about 1,000 y ago, which is followed by distinct expansions across the islands and subsequent bottlenecks consistent with European colonization. These results provide for an increased understanding of Samoan population history and the dynamics that inform it, and also demonstrate how rapid demographic processes can shape modern genomes.
Daniel N. Harris, et al., "Evolutionary history of modern Samoans"Proceedings of the National Academy of Sciences, 201913157 (2020) DOI: 10.1073/pnas.1913157117 

Out Of Equilibrium Galaxies In MOND

Over a Triton Station there was an exchange of comments that made a good point about a distinction between MOND and dark matter particle theories that is worthy of being elevated to a post here (reformatted and with emphasis added, italic text within brackets is mine).

In a nutshell, MOND won't give you predictions about inferred dark matter equivalents when a system is out of equilibrium but it will tell you if a system is out of equilibrium and thus MOND can't be applied straightforwardly to it. For the most part, this conclusion should generalized to any modified gravity theory that would give rise to what are usually understood as dark matter phenomena.
QUESTION: David Schroeder April 14, 2020 at 8:19 am

As a fan of MOND I was a bit shocked to read the latest Starts With A Bang article by Ethan Siegel about the dwarf galaxy Segue 1, which reputedly has a visible mass of only 175 suns, but needs a whopping 600,000 solar masses of Dark Matter to explain internal motions. Might it be possible that external field effects are distorting the motions of this galaxy”s stars to mimic a much greater mass than is actually there? 
ANSWER: tritonstation April 14, 2020 at 9:46 am
This has been known for over a decade, so kinda puzzled why it is “news” now. 
In order to estimate the dark matter mass, one assumes that a system is in dynamical equilibrium. That’s usually a good assumption. Here, it is a terrible assumption. 
Segue 1, and very nearly all of the so-called ultrafaint dwarfs, are deep in the potential of the Milky Way where they are subject to strong tidal forces. This violates the assumption of equilibrium, in any theory. There is an eternal energy source: the stars are not just responding to their own gravitational field (and that of ‘their own’ dark matter). Thus it is likely that the motions of the stars have been stirred up by the external field so that the dynamical mass is overstated. 
In the dark matter galaxy formation picture, one expects small galaxies like this to be accreted by larger galaxies like the Milky Way. In that process, they are tidally stripped. First the outer parts of their dark matter halo, then down to the stars, then ultimately they’re shredded completely. There’s no good way to tell how far along this process Segue 1 is, but it and the other ulrtafaints dwarfs are the poster children for hierarchical accretion. 
In MOND, I had initially thought this was a huge problem (see https://arxiv.org/abs/1003.3448). The external field effect, by itself, does not explain this observation. Long story short, it turns out that tidal effects are even stronger in MOND, and the assumption of dynamical equilibrium certainly does not hold. So – same problem. 
There is one difference: in MOND, there is a quantitative criterion for when an object is not in equilibrium (see https://arxiv.org/abs/astro-ph/0005194). All of the ultrafaints, including Segue 1, fail to meet this criterion [ed. i.e. they are out of equilibrium according to the quantitative test]. There is no chance that the measured velocity dispersion reflects the equilibrium value of an isolated system. Indeed, one can see the onset of this effect in the data (see Figs 6 and 7 of arxiv:1003.3448). From that perspective, this is another successful prediction of MOND: it not only predicts correctly the velocity of stars in equilibrium systems, it also tells you when it can’t. 
There is no equivalent criterion in dark matter. If things don’t work out, we infer that the system is out of equilibrium. The difference is that MOND tells you when this must be invoked. All the famous cases (e.g., And XIX, Crater 2, and a half dozen others whose names I don’t recall offhand) that are now considered to be out of equilibrium in dark matter were predicted in advance by MOND.

Sunday, April 19, 2020

U.S. Droughts Then And Now

The recent drought in the American Southwest was one of the three most severe in tree ring recorded history.
The drought in southwestern North America that lasted from 2000 to 2018 is among the most severe to strike the region in the last 1,200 years, a new study finds. Tree ring–based reconstructions of past climate reveal just one drier 19-year period: a powerful “megadrought” in the late 16th century. The recent drought, researchers say, was made 47 percent more severe by human-caused climate change
Tree rings are yearly growth bands of variable width, depending upon the ready availability of water. Using tree ring records from 1,586 sites across the western United States and northwestern Mexico — amounting to thousands of trees — hydroclimatologist Park Williams of Columbia University and colleagues created a climate history for the region going back to about the year 800. Between about 850 and 1600, several decades-long, intense “megadroughts” struck the region, on a scale not seen again until the present day, the researchers report in the April 17 Science. 
A particularly devastating drought that lasted from about 1575 to 1593 is recounted in historical records and tree ring reconstructions alike, Williams says. “That was a really impressive event, and kind of the last gasp of the megadrought era,” he says. The drought may have contributed to the abandonment of New Mexico pueblos and the devastating spread of disease brought by Spanish conquistadors among Native Americans. 
One of the biggest factors controlling precipitation in southwestern North America is the El Niño-Southern Oscillation, a natural cycle in which changes in tropical Pacific Ocean temperatures can alter regional weather patterns. During “La Niña” episodes of this pattern, colder Pacific sea surface temperatures create atmospheric waves that block Pacific storms from reaching southwestern North America, reducing rainfall. The 16th century megadrought, for example, coincided with a powerful La Niña event
From Science News, citing the following papers:
Severe and persistent 21st-century drought in southwestern North America (SWNA) motivates comparisons to medieval megadroughts and questions about the role of anthropogenic climate change. We use hydrological modeling and new 1200-year tree-ring reconstructions of summer soil moisture to demonstrate that the 2000–2018 SWNA drought was the second driest 19-year period since 800 CE, exceeded only by a late-1500s megadrought. The megadrought-like trajectory of 2000–2018 soil moisture was driven by natural variability superimposed on drying due to anthropogenic warming. Anthropogenic trends in temperature, relative humidity, and precipitation estimated from 31 climate models account for 47% (model interquartiles of 35 to 105%) of the 2000–2018 drought severity, pushing an otherwise moderate drought onto a trajectory comparable to the worst SWNA megadroughts since 800 CE.
A.P. Williams et al., "Large contribution from anthropogenic warming to an emerging North American megadrought."368 Science 314 (April 17, 2020). doi: 10.1126/science.aaz9600.
Historical documents from the Spanish Entrada on the northern frontier of New Spain (now the U.S. Southwest) include anecdotal evidence for unusual aridity in the late 16th century (1). However, a quantitative record of the 16th-century megadrought has only recently been obtained from hundreds of exactly dated and moisture-sensitive tree-ring chronologies developed across Canada, the United States, and Mexico. On page 314 of this issue, Williams et al. (2) provide a new assessment of proxy climate data from the U.S. Southwest. They determine that the 16th-century megadrought was the worst multidecadal drought episode in the Southwest over the past 1200 years, and that the second-worst event occurred from 2000 to 2018 over southwestern North America (SWNA) and may be ongoing. The study also pinpoints substantial anthropogenic (human) contribution to the severity of the current drought.
D.W. Stahle, "Anthropogenic megadrought." 368 Science 238 (April 17, 2020). doi: 10.1126/science.abb6902.

Another megadrought in the American Southwest that left archaeological traces despite actually being less severe than the one in 21st century, came in the late 1200s CE, when the Ancient Puebloans a.k.a. Anasazi precipitously left their complex of villages in Southwest Colorado in the vicinity of Mesa Verde.