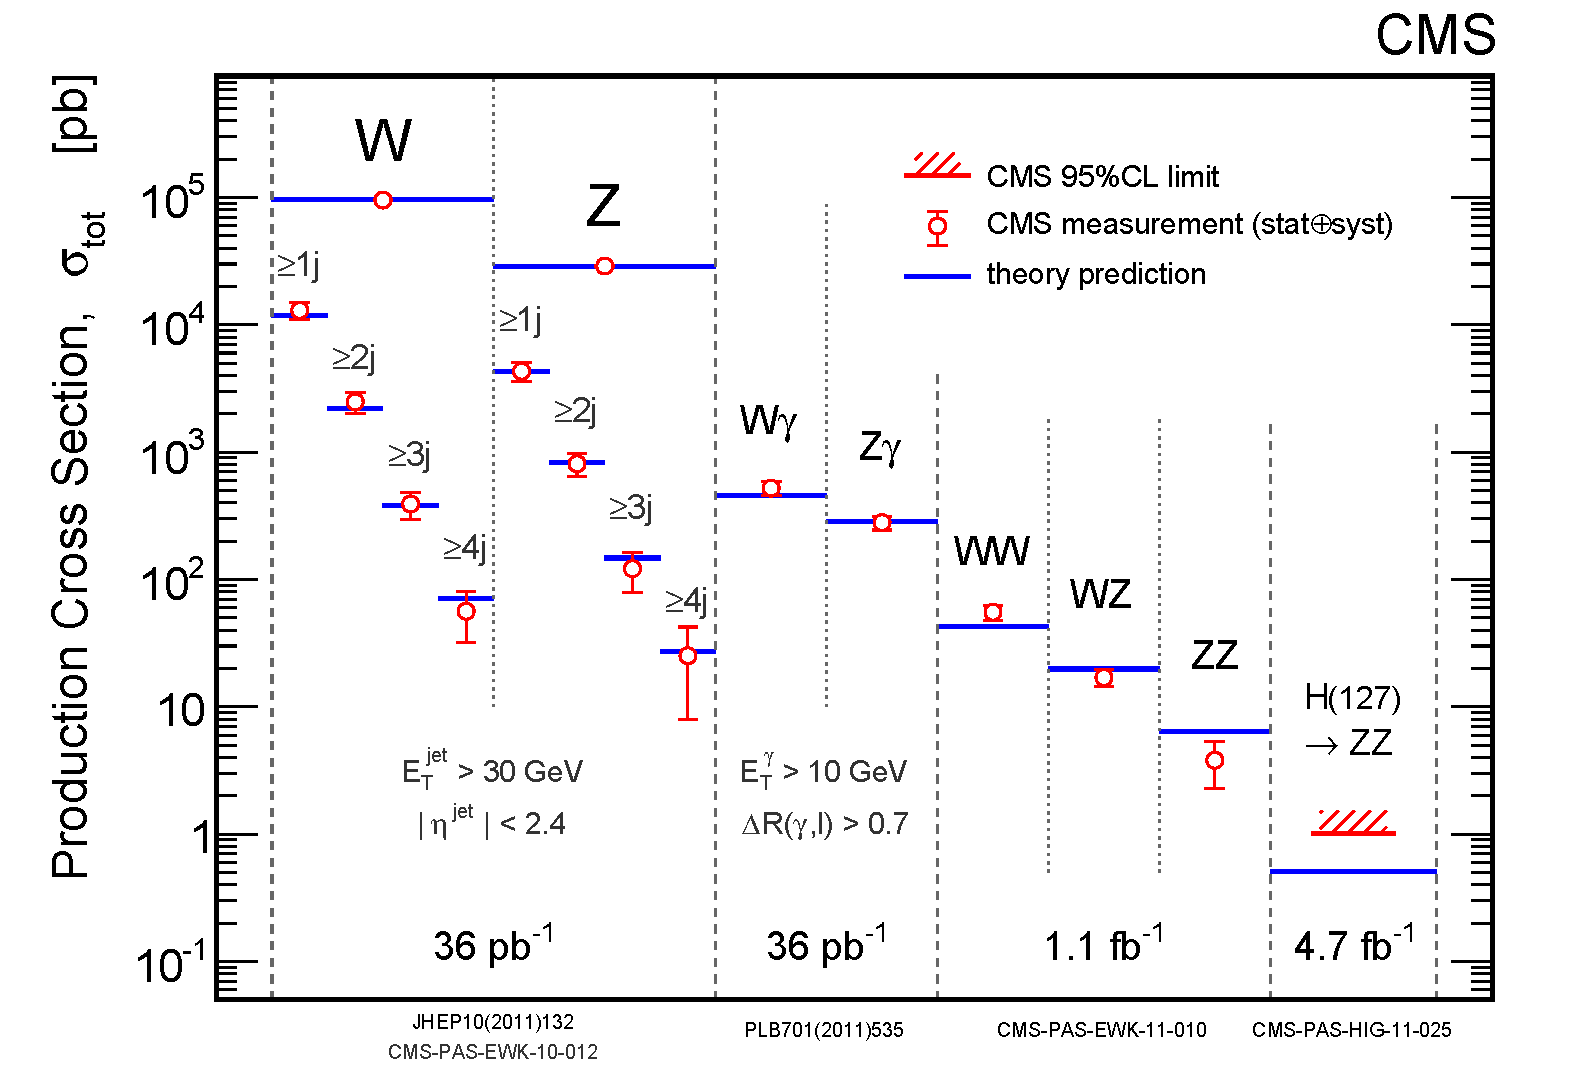
A June 11, 2022 blog post by Tommaso Dorigo provides a somewhat prosaic bit of background data that often gets overlooked in the hype of looking at unusual events and collectively demonstrates the overall soundness of the electroweak part of the Standard Model in a way that I haven't previously blogged.
Look how closely the blue lines that are Standard Model predictions line up with the experimental data except in the last column which uses a pre-Higgs boson discovery mass estimate for the Higgs boson (this line would match up pretty closely too if the experimentally correct Higgs boson mass were used instead).
The graph is old but I can't be bothered with finding the latest-greatest measurement, as it is only for illustrative purposes...

Some explanation of this graph is in order. On the vertical axis you have the production cross section of the different processes, which is basically a rescaled probability - as we said, W production (the leftmost column) takes place once in a million collisions, which is in fact 10^5 picobarns ( a picobarn is 10^-12 barns, and for LHC proton collisions that equates to one in 100 billion collisions).
On the various columns you get to see how the probability becomes smaller as you require the presence of more and more complex final states - two bosons of different kinds, e.g., or even a W plus one or more jets (left sub-bins in the W boson bin).
Another thing to register is that all measured values (red points with uncertainty bars) are in agreement with predictions.
A further note is that this graph was produced in 2011, when the Higgs boson had not been discovered yet - and so the last column, which shows the Higgs decay to a pair of Z bosons, is only showing an upper limit on the cross section!
No comments:
Post a Comment