Thursday, February 27, 2020

Galaxy Formation Simulations Disfavor Warm Dark Matter

A new paper compares simulated galaxy formation in cold dark matter (CDM), self-interacting dark matter (SIDM), and warm dark matter (WDM) models. In the simulation, SIDM models produce galaxies at about the same time as CDM models, while WDM models produce galaxies much later.

Empirically, galaxies are observed to form significantly earlier than predicted in CDM models. This is called the "impossible early galaxies" problem. But, according to this stimulation, self-interacting dark matter models do not to solve the slow galaxy formation problem found in CDM models, and warm dark matter models have the same late galaxy formation problem as CDM models, but one of that is much worse in magnitude, because galaxies form more slowly in WDM models than in CDM or SIDM models. 

This is also a big problem for the dark matter paradigm generally, because the CDM model does not produce the galaxy scale inferred dark matter distributions that are observed. This is the main problem that the SIDM and WDM models were devised to solve and is why these two dark matter theories are the most promising dark matter particle theories currently being considered. 

Of the two, WDM was more attractive than SIDM in many respects, because WDM requires just one kind of dark matter particle, while SIDM requires both a new fundamental dark matter particle and a new dark matter interaction force carrying particle and more free parameters. Also, WDM might have been possible to tie into neutrino physics and the hints of a possible sterile neutrino in measurements of neutrinos oscillations at nuclear reactors.

But, each of these solutions to the galaxy scale problems of CDM (and neither SIDM nor WDM really do a great job of solving that) fails to address the impossible early galaxies problem of CDM. SIDM provides no improvement on this front, and WDM makes the impossible early galaxies problem of CDM significantly worse. So, this paper is a meaningful blow to WDM theories and provides no signs of encouragement for SIDM theories, which an optimist who had not seen the simulation data might have wishfully hoped could have solved the impossible early galaxies problem in addition to improving the galaxy scale behavior of CDM theories.

The paper and its abstract are as follows:

Local Group star formation in warm and self-interacting dark matter cosmologies

Mark R. Lovell (1,2), Wojciech Hellwing (3), Aaron Ludlow (4), Jesús Zavala (1), Andrew Robertson (2), Azadeh Fattahi (2), Carlos S. Frenk (2), Jennifer Hardwick (4) ((1) University of Iceland, (2) ICC Durham, (3) Warsaw, (4) ICRAR/UWA)
The nature of the dark matter can affect the collapse time of dark matter haloes, and can therefore be imprinted in observables such as the stellar population ages and star formation histories of dwarf galaxies. In this paper we use high resolution hydrodynamical simulations of Local Group-analogue (LG) volumes in cold dark matter (CDM), sterile neutrino warm dark matter (WDM) and self-interacting dark matter (SIDM) models with the EAGLE galaxy formation code to study how galaxy formation times change with dark matter model. We are able to identify the same haloes in different simulations, since they share the same initial density field phases. We show that the stellar mass varies systematically with resolution by over a factor of two, in a manner that depends on the final stellar mass. The evolution of the stellar populations in SIDM is largely identical to that of CDM, but in WDM early star formation is instead suppressed. The time at which LG haloes can begin to form stars through atomic cooling is delayed by 200~Myr in WDM models compared to CDM. 70~per~cent of WDM haloes of mass >108M collapse early enough to form stars before z=6, compared to 90~per~cent of CDM and SIDM galaxies. It will be necessary to measure stellar ages of old populations to a precision of better than 100~Myr, and to address degeneracies with the redshift of reionization, in order to use these observables to distinguish between dark matter models.
Comments:17 pages, 13 figures. To be submitted to MNRAS. Contact: lovell@hi.is
Subjects:Astrophysics of Galaxies (astro-ph.GA); Cosmology and Nongalactic Astrophysics (astro-ph.CO); High Energy Physics - Phenomenology (hep-ph)
Cite as:arXiv:2002.11129 [astro-ph.GA]
 (or arXiv:2002.11129v1 [astro-ph.GA] for this version)

CKM Matrix Elements Determined With High Precision

Some of the fundamental constants of the Standard Model of Particle Physics are the four parameters from which the values of the nine element CKM matrix, which describes the probability of quarks turning into different kinds of quarks via the weak force, can be determined.  See generally, this Particle Data Group review regarding the CKM matrix.

The square of the absolute value of each element is equal to the probability of the transition described in the element to the second type of quark in the subscript taking place, given that a W+ boson has been emitted by a quark of the type of the first type of quark shown in the subscript. (This version of the CKM matrix can be converted mathematically to the matrix for W- boson emissions if the complex number values of the matrix elements that reflect the charge parity (CP) violating phase of the matrix are used, rather than merely their absolute values shown in this post.)

The parameters are measured by independently assembling experimental data regarding various kinds of top quark and hadron decays in high energy physics experiments, and from beta decays of radioactive element isotypes, that whose data can be used, in principle, to determine particular CKM matrix element values. This is hard, but has become an increasingly precise science with good instrumentation and large data sets reducing both systemic error and statistical error in these measurements to low levels relative to "theoretical error."

Then, this raw data is converted to numerical values of the matrix elements of the CKM matrix using Lattice QCD and other high energy physics calculations. This is the hardest part by far and provides the limiting factor in the precision with which these matrix elements can be determined at this time.

Once this is done, all that is left is comparatively elementary mathematics and statistics that can be done in a moment using simple computer programs on a PC. First, those independent measurements of individual elements are globally fitted to the nine elements of the CKM matrix based upon their raw values, the uncertainty of each measurement value, and the Standard Model's CKM matrix probability sum rules. There are six different unitarity sum rules that apply to the CKM matrix. Then, one globally fits those nine data points to the four Standard Model CKM matrix parameters (something that can be done in any of several widely used parameterization schemes).

To date, these independent CKM matrix parameter measurements using different kinds of decays have been consistent with the Standard Model sum rules to within the range of measurement errors, providing a strong global check that the Standard Model itself is a sound theory. This check shows that the quantities defined are physically meaningful across a robust range of circumstances, and that there do not appear to be "missing beyond the Standard Model quarks" into which W boson transitions outside the Standard Model (e.g. into hypothetical fourth generation up-type and down-type quarks commonly called t' and b', or into supersymmetric particles) occur. The experimental evidence is consistent with all six of the CKM matrix sum rules and also a sum rule related to other CKM matrix parameters, at the two sigma level, and also suggests that some of the margins of error in those measurements have been conservatively overestimated because the fit is "too good" relative to the stated margin of error (a common situation in the case of electroweak measurements in the Standard Model). As the Particle Data Group review article linked above explains:
Using the independently measured CKM elements mentioned in the previous sections, the unitarity of the CKM matrix can be checked. We obtain |Vud| 2 + |Vus| 2 + |Vub| 2 = 0.9994 ± 0.0005 (1st row), |Vcd| 2 +|Vcs| 2 +|Vcb| 2 = 1.043±0.034 (2nd row), |Vud| 2 +|Vcd| 2 +|Vtd| 2 = 0.9967±0.0018 (1st column), and |Vus| 2 + |Vcs| 2 + |Vts| 2 = 1.046 ± 0.034 (2nd column), respectively. 
The uncertainties in the second row and column are dominated by that of |Vcs|. For the second row, a slightly better check is obtained from the measurement of P u,c,d,s,b |Vij | 2 in Sec. 12.2.4 minus the sum in the first row above: |Vcd| 2 +|Vcs| 2 +|Vcb| 2 = 1.002±0.027. 
These provide strong tests of the unitarity of the CKM matrix. With the significantly improved direct determination of |Vtb|, the unitarity checks for the third row and column have also become fairly precise, leaving decreasing room for mixing with other states. 
The sum of the three angles of the unitarity triangle, α + β + γ = (180 ± 7)◦ , is also consistent with the SM expectation.

The margin of error in these measurements comes predominantly from "theoretical error", i.e. mostly in the process of converting the raw experimental data into the numerical value of the matrix elements of the CKM matrix using Lattice QCD and other theoretical adjustments (e.g. determining the correct renormalization adjustments to make to the raw data based upon estimates of jet energies in hadron decays). 

This is so difficult because, except in the case of top quark decays, which are always to b quarks, except in about 1 in 600 +/- top quark decays, it is impossible to directly measure the decay of an individual free quark because all other quarks are only observed confined into hadrons. So, instead, you have to measure the decay of a composite particle called a hadron, which has more than one quark and many gluons in it, or the decays of the even more complex system of the beta decay of a radioactive isotype of a periodic tale element. Then, you have to used very difficult lattice QCD calculations and other high energy physics calculations in order to use that data to infer the behavior of individual quarks within the decaying composite particles whose decays are actually observed.

So, to grossly oversimplify the matter, the main barrier to getting more precise values for these fundamental CKM matrix constants of the Standard Model is mostly a question of QCD calculations being very cumbersome and requiring almost unfathomable computational power in addition to novel analytical break throughs that are needed to simplify subparts of the calculations involved. As the paper explains:
We have seen that in a number of quantities the theory error is the limiting factor in determining a CKM matrix element. Even in cases for which the experimental and theoretical errors are currently comparable, we can expect that BESIII, Belle II, and LHCb will reduce the experimental errors.
The authors of the paper estimate that theoretical error in these measurements can be reduced by only as much as a factor of five over the next ten years. 

The latest values for the absolute value of eight of those nine quantities are as follows (note that both a direct measurement and a global fit value are provided for both of the first two values listed).


The element for the ninth of these CKM matrix elements, the absolute value of V sub tb, is omitted from the list above. 

This element is omitted because there is currently no experiment sufficiently precise in its measurement of this CKM matrix element (and no experiment will be able to do so for the foreseeable future). A precision of about one part per 600 would be required to determine the amount by which the CKM matrix element for the absolute value of V sub tb differs from 1 with a direct measurement, unless beyond the Standard Model physics were present. But, as the chart above shows, the relevant experimental apparatuses (basically only the now concluded Tevatron experiment, and the Large Hadron Collider a.k.a. the LHC) have a relative precision of only a one part per 23 to one part per 59 at this time at the relevant energy scales.

But, we know that the V sub tb element has a value of approximately 0.999. . . based upon a global fit of CKM matrix element values, and the experimental data is not inconsistent with this estimate. 

This global fit value can be estimated, with back of napkin precision, from the other values based upon the Standard Model rule that the sum of the squares of the absolute values of V sub td, V sub ts, and V sub tb, is equal to exactly 1, representing a probability of 100% that when there is a W boson flavor changing transition of a t quark to one of the down-type quarks that are possible in a possible Standard Model W boson mediated flavor change (i.e. a transition to a down quark, a strange quark, or a bottom quark). 

Wednesday, February 26, 2020

Modern Humans Were In India Without Interruption Pre- And Post-Toba

I've been aware of this for quite a few years, but a Nature Communications article published on February 25, 2020 (per CNN) is making a big splash over the fact that modern human tools are present in India both before and after the Toba eruption (ca. 74,000 years ago), with an indication that there is continuity between the before culture and the after one.

I was mentioning this as old news in an August 15, 2012 post at this blog. I also mention it in a September 24, 2010 post at Wash Park Prophet citing a BBC report regarding a find by Dr Michael Petraglia who is the last listed author of the February 25, 2020 paper.

Presumably the new study strengthens the decade old finds, the abstract suggests, by linking it to other contemporaneous finds. 

It is an important measure of Out of Africa modern human expansion that refutes the naive inference from modern human genetics alone that Out of Africa for modern humans dates to only around 50,000 years ago. The reason for the disconnect between the genetic based date and the archaeology based one is unclear, but the most obvious possibility is widespread population replacement of earlier modern human populations by later Out of Africa, or Out of Arabia or India waves of migration.

Multiple other independent lines of evidence (from the Levant, Arabia, Burma, Indonesia, Australia, Neanderthal and Denisovan DNA, and possibly China) also point to an earlier Out of Africa date. The article and its abstract are as follows:
India is located at a critical geographic crossroads for understanding the dispersal of Homo sapiens out of Africa and into Asia and Oceania. Here we report evidence for long-term human occupation, spanning the last ~80 thousand years, at the site of Dhaba in the Middle Son River Valley of Central India. An unchanging stone tool industry is found at Dhaba spanning the Toba eruption of ~74 ka (i.e., the Youngest Toba Tuff, YTT) bracketed between ages of 79.6 ± 3.2 and 65.2 ± 3.1 ka, with the introduction of microlithic technology ~48 ka. The lithic industry from Dhaba strongly resembles stone tool assemblages from the African Middle Stone Age (MSA) and Arabia, and the earliest artefacts from Australia, suggesting that it is likely the product of Homo sapiens as they dispersed eastward out of Africa.
Chris Clarkson, Michael Petraglia, et al., "Human occupation of northern India spans the Toba super-eruption ~74,000 years ago" 11 Nature Communications Article number: 961 (February 25, 2020).

Tuesday, February 25, 2020

Sardinian Genetic Prehistory With Bell Beaker Implications

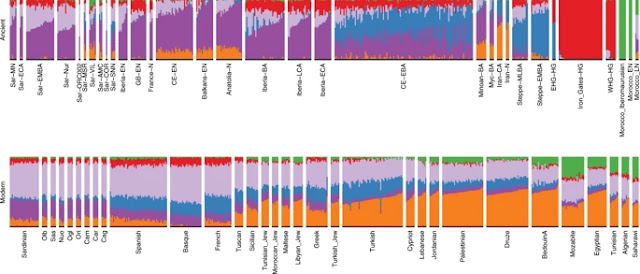
Sardinia is of special interest to students of European genetic prehistory because its residents today are more similar genetically to the first farmers of Europe than any other population on Earth. but, they aren't identical to those first farmers either. It is a population that largely missed the Bell Beaker expansion derived from peoples from the European steppe. The Iberian Basque people are the most closely related population to the Sardinians, due to shared early European farmer ancestry with reduced Steppe influence.

The paper below examines how the Sardinian genome got to be the way it is through a transect of ancient DNA sample from the Middle Neolithic era to Medieval era, compared to modern DNA sample.


The island of Sardinia has been of particular interest to geneticists for decades. The current model for Sardinia’s genetic history describes the island as harboring a founder population that was established largely from the Neolithic peoples of southern Europe and remained isolated from later Bronze Age expansions on the mainland. 
To evaluate this model, we generate genome-wide ancient DNA data for 70 individuals from 21 Sardinian archaeological sites spanning the Middle Neolithic through the Medieval period. 
The earliest individuals show a strong affinity to western Mediterranean Neolithic populations, followed by an extended period of genetic continuity on the island through the Nuragic period (second millennium BCE). Beginning with individuals from Phoenician/Punic sites (first millennium BCE), we observe spatially-varying signals of admixture with sources principally from the eastern and northern Mediterranean. Overall, our analysis sheds light on the genetic history of Sardinia, revealing how relationships to mainland populations shifted over time.
Joseph H. Marcus, et a., "Genetic history from the Middle Neolithic to the present on the Mediterranean island of Sardinia", 11 Nature Communications Article number: 939 (February 24, 2020) (open access).

As usual, the introduction from the body text in a well written paper like this one provides context and a literature review which can be as valuable as the new findings themselves for a beginner (citations omitted):


The whole-genome sequencing in 2012 of “Ötzi”, an individual who was preserved in ice for over 5000 years near the Italo-Austrian border, revealed a surprisingly high level of shared ancestry with present-day Sardinian individuals. Subsequent work on genome-wide variation in ancient Europeans found that most “early European farmer” individuals, even when from geographically distant locales (e.g., from Sweden, Hungary and Spain) have their highest genetic affinity with present-day Sardinian individuals. Accumulating ancient DNA (aDNA) results have provided a framework for understanding how early European farmers show such genetic affinity to modern Sardinians. 
In this framework, Europe was first inhabited by Paleolithic and later Mesolithic hunter-gatherer groups.
Then, starting about 7000 BCE, farming peoples arrived from the Middle East as part of a Neolithic transition spreading through Anatolia and the Balkans while progressively admixing with local hunter-gatherers. 
Major movements from the Eurasian Steppe, beginning about 3000 BCE, resulted in further admixture throughout Europe. 
These events are typically modeled in terms of three ancestry components: western hunter gatherers (“WHG”), early European farmers (“EEF”), and Steppe pastoralists (“Steppe”). Within this broad framework, the island of Sardinia is thought to have received a high level of EEF ancestry early on and then remained mostly isolated from the subsequent admixture occurring on mainland Europe. However, this specific model for Sardinian population history has not been tested with genome-wide aDNA data from the island. 
The oldest known human remains on Sardinia date to ~20,000 years ago. Archeological evidence suggests Sardinia was not densely populated in the Mesolithic, and experienced a population expansion coinciding with the Neolithic transition in the sixth millennium BCE. Around this time, early Neolithic pottery assemblages were spreading throughout the western Mediterranean, including Sardinia, in particular vessels decorated with Cardium shell impressions (variably described as Impressed Ware, Cardial Ware, Cardial Impressed Ware), with radiocarbon dates indicating a rapid westward maritime expansion around 5500 BCE. In the later Neolithic, obsidian originating from Sardinia is found throughout many western Mediterranean archeological sites, indicating that the island was integrated into a maritime trade network. 
In the middle Bronze Age, about 1600 BCE, the “Nuragic” culture emerged, named for the thousands of distinctive stone towers, known as nuraghi. During the late Nuragic period, the archeological and historical record shows the direct influence of several major Mediterranean groups, in particular the presence of Mycenaean, Levantine and Cypriot traders. 
The Nuragic settlements declined throughout much of the island as, in the late 9th and early 8th century BCE, Phoenicians originating from present-day Lebanon and northern Palestine established settlements concentrated along the southern shores of Sardinia. 
In the second half of the 6th century BCE, the island was occupied by Carthaginians (also known as Punics), expanding from the city of Carthage on the North-African coast of present-day Tunisia, which was founded in the late 9th century by Phoenicians. 
Sardinia was occupied by Roman forces in 237 BCE, and turned into a Roman province a decade later. Throughout the Roman Imperial period, the island remained closely aligned with both Italy and central North Africa. 
After the fall of the Roman empire, Sardinia became increasingly autonomous, but interaction with the Byzantine Empire, the maritime republics of Genova and Pisa, the Catalan and Aragonese Kingdom, and the Duchy of Savoy and Piemonte continued to influence the island. 
. . . 
Four previous studies have analyzed aDNA from Sardinia using mitochondrial DNA. Ghirotto et al. found evidence for more genetic turnover in Gallura (a region in northern Sardinia with cultural/linguistic connections to Corsica) than Ogliastra. Modi et al. sequenced mitogenomes of two Mesolithic individuals and found support for a model of population replacement in the Neolithic. Olivieri et al. analyzed 21 ancient mitogenomes from Sardinia and estimated the coalescent times of Sardinian-specific mtDNA haplogroups, finding support for most of them originating in the Neolithic or later, but with a few coalescing earlier. Finally, Matisoo-Smith et al. analyzed mitogenomes in a Phoenician settlement on Sardinia and inferred continuity and exchange between the Phoenician population and broader Sardinia. One additional study recovered β-thalessemia variants in three aDNA samples and found one carrier of the cod39 mutation in a necropolis used in the Punic and Roman periods. Despite the initial insights these studies reveal, none of them analyze genome-wide autosomal data, which has proven to be useful for inferring population history. 
Here, we generate genome-wide data from the skeletal remains of 70 Sardinian individuals radiocarbon dated to between 4100 BCE and 1500 CE. We investigate three aspects of Sardinian population history: 
First, the ancestry of individuals from the Sardinian Neolithic (ca. 5700–3400 BCE)—who were the early peoples expanding onto the island at this time? 
Second, the genetic structure through the Sardinian Chalcolithic (i.e., Copper Age, ca. 3400–2300 BCE) to the Sardinian Bronze Age (ca. 2300–1000 BCE)—were there genetic turnover events through the different cultural transitions observed in the archeological record? 
And third, the post-Bronze Age contacts with major Mediterranean civilizations and more recent Italian populations—have they resulted in detectable gene flow? 
. . . 
our earliest samples show affinity to the early European farmer populations of the mainland, then we observe a period of relative isolation with no significant evidence of admixture through the Nuragic period, after which we observe evidence for admixture with sources from the northern and eastern Mediterranean.
The discussion section of the body text has some key conclusions from the paper, few of which are surprising, but the paper does help clarify, among other things, the non-involvement of Sardinia in the Bell Beaker expansion in the West and Northern Europe. 
First, our analysis provides more refined DNA-based support for the Middle Neolithic of Sardinia being related to the early Neolithic peoples of the Mediterranean coast of Europe. Middle/Late Neolithic Sardinian individuals fit well as a two-way admixture between mainland EEF and WHG sources, similar to other EEF populations of the western Mediterranean. 
Further, we detected Y haplogroups R1b-V88 and I2-M223 in the majority of the early Sardinian males. Both haplogroups appear earliest in the Balkans among Mesolithic hunter-gatherers and then Neolithic groups and later in EEF Iberians, in which they make up the majority of Y haplogroups, but have not been detected in Neolithic Anatolians or more western WHG individuals. These results are plausible outcomes of substantial gene flow from Neolithic populations that spread westward along the Mediterranean coast of southern Europe around 5500 BCE (a “Cardial/Impressed” ware expansion). We note that we lack autosomal aDNA from earlier than the Middle Neolithic in Sardinia and from key mainland locations such as Italy, which leaves some uncertainty about timing and the relative influence of gene flow from the Italian mainland versus from the north or west. . . .  
From the Middle Neolithic onward until the beginning of the first millennium BC, we do not find evidence for gene flow from distinct ancestries into Sardinia. That stability contrasts with many other parts of Europe which had experienced substantial gene flow from central Eurasian Steppe ancestry starting about 3000 BCE and also with many earlier Neolithic and Copper age populations across mainland Europe, where local admixture increased WHG ancestry substantially over time. We observed remarkable constancy of WHG ancestry (close to 17%) from the Middle Neolithic to the Nuragic period. While we cannot exclude influx from genetically similar populations (e.g., early Iberian Bell Beakers), the absence of Steppe ancestry suggests genetic isolation from many Bronze Age mainland populations—including later Iberian Bell Beakers. As further support, the Y haplogroup R1b-M269, the most frequent present-day western European haplogroup and associated with expansions that brought Steppe ancestry into Britain and Iberia about 2500–2000 BCE, remains absent in our Sardinian sample through the Nuragic period (1200–1000 BCE). . . . .In particular, we find that the Nuragic period is not marked by shifts in ancestry, arguing against hypotheses that the design of the Nuragic stone towers was brought with an influx of people from eastern sources such as Mycenaeans. 
Following the Nuragic period, we found evidence of gene flow with both northern and eastern Mediterranean sources. We observed eastern Mediterranean ancestry appearing first in two Phoenician-Punic sites (Monte Sirai, Villamar). The northern Mediterranean ancestry became prevalent later, exemplified most clearly by individuals from a north-western Medieval site (San Nicola Necropoli). Many of the post-Nuragic individuals could be modeled as direct immigrants or offspring from new arrivals to Sardinia, while others had higher fractions of local Nuragic ancestry. . . . Overall though, we find support for increased variation in ancestry after the Nuragic period, and this echoes other recent aDNA studies in the Mediterranean that have observed fine-scale local heterogeneity in the Iron Age and later. 
In addition, we found present-day Sardinian individuals sit within the broad range of ancestry observed in our ancient samples. A similar pattern is seen in Iberia and central Italy, where variation in individual ancestry increased markedly in the Iron Age, and later decreased until present-day. . . . . the major Phoenician and Punic settlements in the first millennium BCE were situated principally along the south and west coasts, and Corsican shepherds, speaking an Italian-Corsican dialect (Gallurese), immigrated to the northeastern part of Sardinia. 
Our inference of gene flow after the second millennium BCE seems to contradict previous models emphasizing Sardinian isolation. These models were supported by admixture tests that failed to detect substantial admixture, likely because of substantial drift and a lack of a suitable proxy for the Nuragic Sardinian ancestry component. However, compared with other European populations, we confirm Sardinia experienced relative genetic isolation through the Bronze Age/Nuragic period. 
In addition, we find that subsequent admixture appears to derive mainly from Mediterranean sources that have relatively little Steppe ancestry. Consequently, present-day Sardinian individuals have retained an exceptionally high degree of EEF ancestry and so they still cluster with several mainland European Copper Age individuals such as Ötzi, even as they are shifted from ancient Sardinian individuals of a similar time period. 
The Basque people, another population high in EEF ancestry, were previously suggested to share a genetic connection with modern Sardinian individuals. We observed a similar signal, with modern Basque having, of all modern samples, the largest pairwise outgroup-f3 with most ancient and modern Sardinian groups. While both populations have received some immigration, seemingly from different sources, our results support that the shared EEF ancestry component could explain their genetic affinity despite their geographic separation. 

Friday, February 21, 2020

The Testimony Of The Goat

An new paper examining ancient goat Y-DNA and also Y-DNA from modern goats from sixteen different breeds and seven species of wild goats, largely reinforces the paradigmatic narrative regarding the expansion of farming from the Fertile Crescent Neolithic revolution already supported by archaeological and human DNA evidence. 

It turns out that all domesticated goats in the world are predominantly derived from the bezoar goat (a.k.a. bezoar ibex a.k.a. mountain goat) which is native to the vicinity of the forested parts of the highlands of Anatolia (a.k.a. Asia Minor, now mostly in a country called Turkey) and Persia (now called Iran) (more generally "West Asia") where they were one of the first animals domesticated in the Fertile Crescent Neolithic Revolution. As Wikipedia explains:
The bezoar ibex (Capra aegagrus aegagrus), also known as the Anatolian bezoar ibex, Persian ibex, or (by Anatolian locals) dağ keçisi (Turkish: 'mountain goat'), is a wild goat subspecies that is native to montane forests from Turkey to Iran.
The bezoar ibex is found in the mountains of Asia Minor and across the Middle East. It is also found on some Aegean islands and in Crete, where it is accepted that the goats constitute relict populations of very early domestic animals that were taken to the Mediterranean islands during the prehistoric period and now live as feral populations. The bezoar ibex, if not the sole progenitor of the modern domestic goat, is at least its main progenitor. The archaeological evidence traces goat domestication as far back as c. 10,500 years Before Present, and DNA evidence suggests 10,000 years BP.
In particular, the geographic distribution of goat Y-DNA shows the distinction between the LBK and Cardial Pottery waves first farmer migrations. It also shows a separate wave of goat herding migration with a different mix of lineages than in Europe, that were likely spread across Africa via the Egyptian Neolithic.

A more notable finding is that almost all domesticated South Asian, Southeast and East Asian goats, other than those arriving within the  modern era (i.e. starting no earlier than last five hundred years or so, and perhaps even in the 20th century) in Korea and Japan, appear to be derived from lineages (some of which are rare in Europe and Africa) of Fertile Crescent Neolithic Iranian goats, rather than deriving from an independent domestication. This indicates that economically significant long distance trade between West Eurasia and East Eurasia at some point in the prehistoric Holocene era. The exact timing can probably be accurately estimated based upon the time at which remains of goats are first attested in these places, but that data isn't available in this particular paper.

Another interesting point is that while Madagascar was settled by a population of mixed East African and Indonesian origins, its goats all have African origins, even though its language is almost entirely Indonesian (and Austronesian) in origins. This adds another data point to the unclear question of what the nature of the relationship between the Indonesian and East African founders of Madagascar had with each other.

It is also rather remarkable how long an imprint of Neolithic migrations seem to have endured pretty much worldwide, despite significant global trade that goes deep into prehistory. The immense turnover of human populations in the Bronze Age in Europe and Southeast Asia, and in the Bantu expansion in Africa, appear to have overlooked goats.

The new preprint about this topic and its abstract are as follows:
The male-specific part of the Y-chromosome is in mammalian and many other species the longest haplotype that is inherited without recombination. By its paternal transmission it has a small effective population size in species with dominant males. In several species, Y-chromosomal haplotypes are sensitive markers of population history and introgression. Previous studies have identified in domestic goats four major Y-chromosomal haplotypes Y1A, Y1B, Y2A and Y2B with a marked geographic differentiation and several regional variants. In this study we used published whole-genome sequences of 70 male goats from 16 modern breeds, 11 ancient-DNA samples and 29 samples from seven wild goat species.  
We identified single-copy male-specific SNPs in four scaffolds, containing SRY, ZFY, DBY with SSX3Y and UTY, and USP9Y with UMN2001, respectively. Phylogenetic analyses indicated haplogroups corresponding to the haplotypes Y1B, Y2A and Y2B, respectively, but Y1A was split into Y1AA and Y1AB. All haplogroups were detected in ancient DNA samples from southeast Europe and, with the exception of Y1AB, in the bezoar goat, which is the wild ancestor of the domestic goats. Combining these data with those of previous studies and with genotypes obtained by Sanger sequencing or the KASP assay yielded haplogroup distributions for 132 domestic breeds or populations. The phylogeographic differentiation indicated paternal population bottlenecks on all three continents. This possibly occurred during the Neolithic introductions of domestic goats to those continents with a particularly strong influence in Europe along the Danubian route. This study illustrates the power of the Y-chromosomal haplotype for the reconstructing the history of mammalian species with a wide geographic range.
Isaäc J. Nijman, et al., "Phylogeny and distribution of Y-chromosomal haplotypes in domestic, ancient and wild goats" bioRxiv (February 17, 2020) doi: https://doi.org/10.1101/2020.02.17.952051

From the body text (citations omitted):

A preliminary analysis of the Y-chromosomal diversity in European and Turkish goats defined the three haplotypes Y1A, Y1B and Y2, showing strong geographic differentiation. The same haplotypes were found in goats from Portugal and North-Africa, Turkey, east and south Asia, Switzerland and Spain with additional haplotypes Y2B in east Asia, Y2C in Turkish Kilis goats, and Y1B2 as well Y1C mainly in Switzerland. . . . 
Remarkably, with the exception of Y1B the haplogroups have all been found in Iranian bezoar samples, whereas all haplogroups, including Y1B, were detected in ancient goat samples. 
Geographic plots of haplogroup frequencies show a considerable spatial differentiation, which resonates the strong phylogeography displayed by autosomal SNPs, but is in clear contrast with the phylogenetic structure displayed by mtDNA haplogroups. Most likely, by a series of bottlenecks in the male lineage subcontinents have different major haplogroups, while none has a global-wide coverage:

- Haplogroup Y2B is absent in Europe, Africa and west Asia, but became a major haplotype in east Asia and southeast Asian, where Y2A is not represented. In contrast, it is observed in ancient goat from Medieval Georgia and Neolithic Iran (ca. 6,000 BCE), supporting an origin of east Asian goat from regions east of Zagros Mountains.

- Y2A is in northern and central Europe only found in the crossbred AngloNubia, but is the predominant haplogroup in central, eastern and southern Africa.

- Haplogroup Y1B is predominant in northern Europe, but outside Europe and North African has only been found in one Karamonja animal, in the Korean native breed and in exported Saanen populations. 
The different Y2A and Y1B frequencies in north-central vs southern Europe may reflect the Neolithic migrations following the Danube and the Mediterranean routes, respectively with the strongest bottlenecks along the northernmost migrations.

- Y1AA is sporadic in Europe and has been observed also in Neolithic Serbia (ca. 6,000 BCE), but is present in Asia. 
Deviations from the general pattern may very well reflect major introgressions. A well-known example is the Anglo-Nubian, which originated in England by crossing Indian or African imported goats with local breeds and is in our panel the only northern-European breed carrying Y2A. 
There were two out-of-range findings of Y1B, in the Uganda Karamonja and in the Korean native breeds. Because of the popularity of Swiss dairy goats in both Uganda and Korea, crossbreeding again is the most likely explanation. 

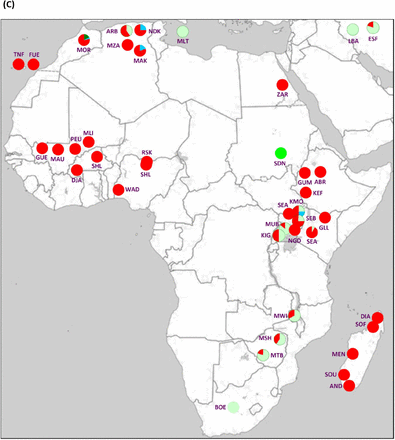
Fig. 2.
Haplogroup distributions of (A) European breeds; (B) Asian breeds; (C) African breeds; (A, B), European and Asian ancient DNA samples; and (B) Iranian bezoars. 
Breeds represented by a single goat are not plotted or are combined with other breeds from the same country. 
Breed codes: ABA, Abaza; ALP, Alpine; ANB, AngloNubian; AND, Androy; ANK, Angora;Ankara; APP, Appenzell; ARA, Arabia; ARG, Argentata dell’Etna; ARR, Arran; ARW, Arapawa; BAG, Bagot; BAL, Balearic; BBG, Black Bengal; BEY, Bermeya; BHU, Bhutan; BIO, Bionda dell’Amadello; BLA, Blanca Andaluzza; BLB, Bilbery; BLO, Blobe; BOE, Boer; BRA, British Alpine; BRV, Bravia; BUK, Polish Fawn Colored; CAM, Cambodja; CAP, Capore; CHN, North China (Xinjiang, Henan Raoshan White, Shandong); CHQ, Charnequeira; CHV, Cheviot; COR, Corsican; CRO, Croatian Spotted; CRP, Carpathian; DIA, Diana; DJA, Djallonke; DKL, Danish Landrace; DPG, Dutch Pied Goat; DRZ, Dreznica; DUK, Dukati; DUL, Dutch Nordic Goat; ESF, Esfahan; ETH, Ethiopian (Abergelle, Gumez, Keffa); FIN, Finnish; FLR, Florida; FUE, Fuenteventura (Ajuy, Majorera); GAL, Galla; GAR, Garganica; GDR, Guadarrama; GGT, Girgentata; GMO, Grigia Molisana; GRG, Greek; GRS, Grisons Striped; GUE, Guéra; GUR, Gurcu; HAI, Hair; HAS, Hasi; HNM, Honamli; IND, Indian; IRA, Iranian; JPA, Shjiba; JSA, Japanese Saanen; KIG, Kigezi; KIL, Kil; KLS, Kilis; KMO, Karamonja; KON, Korean Native; KSA, Korean Saanen; LAO, Laos; LBA, Lori-Bakhtiari; lCL, Icelandic; LIQ, Liqenasi; MAK, Makatia; MAT, Mati; MAU, Maure; MEN, Menabe; MGL, Mongolian; MLG, Malagueña; MLI, Naine, Soudanaise Targui; MLT, Maltese; MLW, Malawi (Balaka-Ulonge, Dedza;Lilongwe; MOR, Moroccan; MSH, Mashona; MTB, Matebele; MUB, Mubende; MUG, Murciano Granadina; MUL, Mulranny; MUZ, Muzhake; MYA, Myanmar; MZA, M’Zabite; NCG, Norwegian Coastal; NDG, Norwegian Dairy; NDZ, Norduz; NGD, Nganda; NKA, Naine de Kabylie; ORO, Orobica; PCG, Peacock; PEU, Peulh; PHI, Philippines; PIZ, Pinzgauer; PYR, Pyrenean; PYY, Payoya; QHI, Qinhai; RAS, Rasquera; ROV, Rove; RSK, Nigerian Maradi (Red Sokoto); SAA, Saanen; SAR, Sarda; SCA, Shaanbe Cashmere; SDN, Sudan; SEA, Small East African (Kenya, Uganda); SEB, Sebei; SRP, Serpentina; SER, Serrana; SGB, St Gallen Booted; SHL, Shahel; SHL, Nigerian Sahel; SKO, Skopelos; SOF, Sofia; SOU, Southwest; SSG, Steirische Schecken; TAS, Tauernschecken; TER, Teramo; TIB, Tibetan; TNF, Tinerfena (Norte, Sud); TOG, Toggenburg; TWZ, Thuringian Forest; VAL, Valdostana; VBN, Valais Blackneck; VIE, Vietnam; VRT, Verata; VZC, Verzasca; WAD, West African Dwarf; ZAR, Zaraiba.

Wednesday, February 19, 2020

Mirror Universe Cosmology

The article below and the article it discusses, capture well what I view to be the most likely explanation for the matter-antimatter asymmetry of the universe. 

It is attractive, in part, because it reduces the theoretical impulse to try to find baryon number and lepton number violating processes for which there is zero experimental support and there are strong experimental constraints. Most BSM (beyond the Standard Model) theories and GUTs (grand unified theories) hypothesize such process to explain matter-antimatter asymmetry, and all of them are a huge waste of time and dead ends, a priori, and not worth wasting time considering, if an explanation that does not violate the Standard Model exists.

CPT Symmetry in Projective de Sitter Universes

In a recent work, Turok, Boyle and Finn hypothesized a model of universe that does not violate the CPT-symmetry as alternative for inflation. With this approach they described the birth of the Universe from a pair of universes, one the CPT image of the other, living in pre- and post-big bang epochs. The CPT-invariance strictly constrains the vacuum states of the quantized fields, with notable consequences on the cosmological scenarios. Here we examine the validity of this proposal by adopting the point of view of archaic cosmology, based on de Sitter projective relativity, with an event-based reading of quantum mechanics, which is a consequence of the relationship between the universal information reservoir of the archaic universe and its out-of-equilibrium state through quantum jumps. In this scenario, the big bang is caused by the instability of the original (pre)vacuum with respect to the nucleation of micro-events that represent the actual creation of particles. Finally, we compare our results with those by Turok et al., including the analytic continuation across the big bang investigated by Volovik and show that many aspects of these cosmological scenarios find a clear physical interpretation by using our approach. Moreover, in the archaic universe framework we do not have to assume a priori the CPT-invariance like in the other models of universe, it is instead a necessary consequence of the archaic vacuum structure and the nucleation process, divided into two specular universes.
Comments:7 pages
Subjects:General Relativity and Quantum Cosmology (gr-qc); Quantum Physics (quant-ph)
Cite as:arXiv:2002.07550 [gr-qc]
(or arXiv:2002.07550v1 [gr-qc] for this version)

Related prior posts:


* The Anti-Universe (January 28, 2019) (discussing the paper referred to in the abstract).

Tuesday, February 18, 2020

A New Higgs Boson Mass Measurement From CMS

The latest Higgs boson mass measurement from the CMS experiment, in the highly precise diphoton decay channel is 125.78 ± 0.26 GeV, which is 2.3 sigma above the current PDG value and modifies the combined value from CMS to 125.38 ± 0.14 GeV.

This tends to pull up the global average measurement of the Higgs boson mass from its Particle Data Group value of 125.10 ± 0.14 GeV which incorporated a combined value of 125.25 ± 0.20 ± 0.08 from CMS. The PDG used a value of 124.86 ± 0.27 from the ATLAS experiment. Since the new CMS number is very precise, this new measurement receives considerable weight in that determination, and probably pulls the global average up to 125.20 GeV, with a smaller margin of error than the current 0.14 GeV. The ATLAS combined average and the CMS combined average are consistent with each other at roughly the 1.7 sigma level.

A measurement of the Higgs boson mass in the diphoton decay channel

A measurement of the mass of the Higgs boson in the diphoton decay channel is presented. This analysis is based on 35.9 fb1 of proton-proton collision data collected during the 2016 LHC running period, with the CMS detector at a center-of-mass energy of 13 TeV. A refined detector calibration and new analysis techniques have been used to improve the precision of this measurement. The Higgs boson mass is measured to be mH= 125.78±0.26 GeV. This is combined with a measurement of mH already performed in the HZZ4 decay channel using the same data set, giving mH= 125.46±0.16 GeV. This result, when further combined with an earlier measurement of mH using data collected in 2011 and 2012 with the CMS detector, gives a value for the Higgs boson mass of mH= 125.38±0.14 GeV. This is currently the most precise measurement of the mass of the Higgs boson.
Submitted to Phys. Lett. B. All figures and tables can be found at this http URL (CMS Public Pages)

Analysis

First, it is notable that the uncertainty in the Higgs boson mass is now almost down to 1 part per 1,000. This is not bad for a particle just discovered in 2012 that basically only one experimental apparatus in the world has an ability to directly observe.

Among other things, this measurement, together with a recent reanalysis of the top quark mass measurement at D0 make the conclusion that the sum of the square of the fundamental boson masses is greater than the sum of the square of the fundamental fermion masses more significant.

The new Higgs boson global average mass is 4.2 sigma (548 MeV) larger than the value necessary for the sum of the squares of the fundamental boson masses to equal one half of the square of the Higgs vev. The new top quark global average is 3.4 sigma (1,375 MeV) smaller than the value necessary for the sum of squares of the fundamental fermion masses to equal one half of the the square of the Higgs vev.

It isn't clear what significance to attach to this discrepancy in which there is a modest boson heavy bias relative to fermions in the Standard Model mass matrix when viewed in this manner.

But, the discrepancy from the values of the Higgs boson mass and top quark mass from those that would be required to make the sum of the square of the fundamental Standard Model particle masses equal to the square of the Higgs vev is much smaller. If the Higgs boson mass were 1.3 sigma higher (168 MeV, i.e. 125.368 GeV) and the top quark mass were also 1.3 sigma higher (517 MeV, i.e. 173.187 GeV), this relationship, sometimes called the LP & C relationship after the authors of the first paper to suggest the relationship, would be satisfied.