The results show that contrary to previous studies, hunter-gatherers in the Caucasus and farmers in Europe and Anatolia are all descended from the central meta population. This metapopulation received about 14,200 years ago a contribution (14%) from the western metapopulation. The ancestors of the farmers of Iran did not receive this western contribution. The central and eastern metapopulations diverged about 15,800 years ago.The ancestors of the European and Anatolian farmers received a second gene flow (15%) from the western meta population about 12,900 years ago. The ancestors of the Caucasian hunter-gatherers did not receive this second contribution. The ancestors of European and Anatolian farmers then underwent a major genetic drift between 12,900 and 9,100 years ago due to a strong reduction in their population.
Monday, May 16, 2022
Origins Of The First Fertile Crescent Neolithic Farmers
An Eighth Predicted Decay Channel Of The Higgs Boson?
b-quark pairs, 57.7% (observed)W boson pairs, 21.5% (observed)gluon pairs, 8.57%tau-lepton pairs, 6.27% (observed)c-quark pairs, 2.89%Z boson pairs, 2.62% (observed)photon pairs, 0.227% (observed)Z boson and a photon, 0.153% (observed)muon pairs, 0.021 8% (observed)electron-positron pairs, 0.000 000 5%
A search for the standard model Higgs boson decaying to a charm quark-antiquark pair, H →cc¯, produced in association with a leptonically decaying V (W or Z) boson is presented. The search is performed with proton-proton collisions at s√ = 13 TeV collected by the CMS experiment, corresponding to an integrated luminosity of 138 fb−1. Novel charm jet identification and analysis methods using machine learning techniques are employed.
The analysis is validated by searching for Z →cc¯ in VZ events, leading to its first observation at a hadron collider with a significance of 5.7 standard deviations.
The observed (expected) upper limit on σ(VH)(H→cc¯) is 0.94 (0.50+0.22−0.15) pb at 95% confidence level (CL), corresponding to 14 (7.6+3.4−2.3) times the standard model prediction. For the Higgs-charm Yukawa coupling modifier, κc, the observed (expected) 95% CL interval is 1.1 <|κC|< 5.5 (|κc|< 3.4), the most stringent constraint to date.
Friday, May 6, 2022
Medieval English Diets Even For Elites Had Very Few Animal Products
Analysis in a new paper (here) of the remains of two thousand medieval British people from the pre-Norman Anglo-Saxon era, to determine the makeup of their diets based upon their bone chemistry, show that no one in that era, even elite aristocrats, ate much meat, dairy, or eggs. Many people approached vegan status, based upon what their remains showed that they ate.
This was unexpected, because many food animals were listed on documentation of tribute requirements of royal subjects that survive from that era. If the tributes were authentic and collected, then that means that the feasts that the meats collected at that time for, were infrequent and usually would have included many hundreds of basically ordinary people, and maybe almost everyone in the community.
An author of the paper explains more in a blog post with this money quote:
We’re looking at kings travelling to massive barbecues hosted by free peasants, people who owned their own farms and sometimes slaves to work on them.
The related papers are:
A Eurasian Stone Age Ancient DNA Megapaper
A new preprint analyzes a huge number of new ancient DNA samples from stone age Eurasia (Hat tip to Razib Khan). Despite its claim "Eurasian" scope, it covers pretty much only Europe and part of Siberia. The paper largely confirms and refines existing paradigms and expectations.
LVN = ancestry maximized in Anatolian farmer populations. WHG = ancestry maximized in western European hunter gatherers. EHG = ancestry maximized in eastern European hunter-gatherers. IRN = ancestry maximized in Iranian Neolithic individuals and Caucasus hunter-gatherers.
Razib clarifies beyond the abstract that:
New hunter-gatherer cluster with a focus in the eastern Ukraine/Russian border region. Between the Dnieper and Don. . . .Scandinavia seems to have had several replacements even after the arrival of the early Battle Axe people. This is clear in Y chromosome turnover, from R1a to R1b and finally to mostly I1, the dominant lineage now. They claim that later Viking and Norse ancestry is mostly from the last pulse during the Nordic Bronze Age. . . .it’s clear that Neolithic ancestry in North/Central/Eastern Europe was from Southeast Europe, while that in Western Europe was from Southwest Europe. . . .They find the African R1b around Lake Chad in some Ukrainian samples.
Newly reported samples belonging to haplogroup R1b were distributed between two distinct groups depending on whether they formed part of the major European subclade R1b1a1b (R1b-M269).
Individuals placed outside this subclade were predominantly from Eastern European Mesolithic and Neolithic contexts, and formed part of rare early diverging R1b lineages (Fig. S3b.6). Two Ukrainian individuals belonged to a subclade of R1b1b (R1b-V88) found among present-day Central and North Africans, lending further support5,10 to an ancient Eastern European origin for this clade.
Haplogroup R1b1a1a (R1b-M73) was frequent among Russian Neolithic individuals.
Individuals placed within the R1b-M269 clade on the other hand were from Scandinavian Late Neolithic and early Bronze Age contexts (Fig. S3b.6). Interestingly, more fine-scale sub-haplogroup placements of those individuals revealed that Y chromosome lineages distinguished samples from distinct genetic clusters inferred from autosomal IBD sharing (Fig. S3b.6, S3b.7). In particular, individuals associated with the Scandinavian cluster Scandinavia_4200BP_3200BP were all placed within the sub-haplogroup R1b1a1b1a1a1 (R1b-U106), whereas the two Scandinavian males associated with the Western European cluster Europe_4500BP_2000BP were placed within R1b1a1b1a1a2 (R1b-P312) (Fig. S3b.7).
Figure S3b.6 is as follows and is basically unreadable since even when magnified 500% the resolution isn't fine enough to make it readable, but is presumably referencing the two most basal portions of the circular chart which start in approximately the three o'clock position and evolve counterclockwise. Presumably R1b-V88 is the tree closest to the three o'clock position because it has two samples from the current study in purple/pinkish, while the next tree counterclockwise from it is probably R1b-M73 which has many samples from the study, consistent with the text quoted above.
The footnoted references 5 and 10 to this part of the Supplemental Materials were:
5. Haber, M. et al. "Chad Genetic Diversity Reveals an African History Marked by Multiple Holocene Eurasian Migrations". Am. J. Hum. Genet. 0, (2016). The abstract of this paper states:
Understanding human genetic diversity in Africa is important for interpreting the evolution of all humans, yet vast regions in Africa, such as Chad, remain genetically poorly investigated. Here, we use genotype data from 480 samples from Chad, the Near East, and southern Europe, as well as whole-genome sequencing from 19 of them, to show that many populations today derive their genomes from ancient African-Eurasian admixtures.
We found evidence of early Eurasian backflow to Africa in people speaking the unclassified isolate Laal language in southern Chad and estimate from linkage-disequilibrium decay that this occurred 4,750–7,200 years ago. It brought to Africa a Y chromosome lineage (R1b-V88) whose closest relatives are widespread in present-day Eurasia; we estimate from sequence data that the Chad R1b-V88 Y chromosomes coalesced 5,700–7,300 years ago.
This migration could thus have originated among Near Eastern farmers during the African Humid Period. We also found that the previously documented Eurasian backflow into Africa, which occurred ~3,000 years ago and was thought to be mostly limited to East Africa, had a more westward impact affecting populations in northern Chad, such as the Toubou, who have 20%–30% Eurasian ancestry today.
We observed a decline in heterozygosity in admixed Africans and found that the Eurasian admixture can bias inferences on their coalescent history and confound genetic signals from adaptation and archaic introgression.
and
10. Marcus, J. H. et al. "Genetic history from the Middle Neolithic to present on the Mediterranean island of Sardinia." Nat. Commun. 11, 1–14 (2020) (pertinent Supplemental Information here). The abstract of this paper states:
The island of Sardinia has been of particular interest to geneticists for decades. The current model for Sardinia’s genetic history describes the island as harboring a founder population that was established largely from the Neolithic peoples of southern Europe and remained isolated from later Bronze Age expansions on the mainland.
To evaluate this model, we generate genome-wide ancient DNA data for 70 individuals from 21 Sardinian archaeological sites spanning the Middle Neolithic through the Medieval period. The earliest individuals show a strong affinity to western Mediterranean Neolithic populations, followed by an extended period of genetic continuity on the island through the Nuragic period (second millennium BCE). Beginning with individuals from Phoenician/Punic sites (first millennium BCE), we observe spatially-varying signals of admixture with sources principally from the eastern and northern Mediterranean. Overall, our analysis sheds light on the genetic history of Sardinia, revealing how relationships to mainland populations shifted over time.
The relevant language in the Supplemental Information states:
The 1240k read capture data allowed us to call several R1b subclades in ancient individuals (see Supp. Fig. 7 for overview of available markers). While R1b-M269 was absent from our sample of ancient Sardinians until the Nuragic period, we detected R1b-V88 equivalent markers in 11 out of 30 ancient Sardinian males from the Middle Neolithic to the Nuragic with Y haplogroup calls. Two ancient individuals carried derived markers of the clade R, but we could not identify more refined subclades due to their very low coverage (Supp. Data 1B). The ancient geographic distribution of R1b-V88 haplogroups is particularly concentrated in the Seulo caves sites and the South of the island (Supp. Data 1B).
At present, R1b-V88 is prevalent in central Africans, at low frequency in present-day Sardinians, and extremely rare in the rest of Europe58. By inspecting our reference panel of western Eurasian ancient individuals, we identified R1b-V88 markers in 10 mainland European ancient samples (Fig. 8), all dating to before the Steppe expansion (ą 3k years BCE). Two very basal R1b-V88 (with several markers still in the ancestral state) appear in Serbian HGs as old as 9,000 BCE (Fig. 9), which supports a Mesolithic origin of the R1bV88 clade in or near this broad region. The haplotype appears to have become associated with the Mediterranean Neolithic expansion - as it is absent in early and middle Neolithic central Europe, but found in an individual buried at the Els Trocs site in the Pyrenees (modern Aragon, Spain), dated 5,178-5,066 BCE59 and in eleven ancient Sardinians of our sample. Interestingly, markers of the R1b-V88 subclade R1b-V2197, which is at present day found in Sardinians and most African R1b-V88 carriers, are derived only in the Els Trocs individual and two ancient Sardinian individuals (MA89, 3,370-3,110 BCE, MA110 1,220-1,050 BCE) (Fig. 9). MA110 additionally carries derived markers of the R1b-V2197 subclade R1b-V35, which is at present-day almost exclusively found in Sardinians58.
This configuration suggests that the V88 branch first appeared in eastern Europe, mixed into Early European farmer individuals (after putatively sex-biased admixture60), and then spread with EEF to the western Mediterranean. Individuals carrying an apparently basal V88 haplotype in Mesolithic Balkans and across Neolithic Europe provide evidence against a previously suggested central-west African origin of V88 61. A west Eurasian R1b-V88 origin is further supported by a recent phylogenetic analysis that puts modern Sardinian carrier haplotypes basal to the African R1b-V88 haplotypes 58. The putative coalescence times between the Sardinian and African branches inferred there fall into the Neolithic Subpluvial (“green Sahara”, about 7,000 to 3,000 years BCE). Previous observations of autosomal traces of Holocene admixture with Eurasians for several Chadic populations 62 provide further support for a speculative hypothesis that at least some amounts of EEF ancestry crossed the Sahara southwards. Genetic analysis of Neolithic human remains in the Sahara from the Neolithic Subpluvial would provide key insights into the timing and specific route of R1b-V88 into Africa - and whether this haplogroup was associated with a maritime wave of Cardial Neolithic along Western Mediterranean coasts 63 and subsequent movement across the Sahara 58,64.
Overall, our analysis provides evidence that R1b-V88 traces back to eastern European Mesolithic hunter gatherers and later spread with the Neolithic expansion into Iberia and Sardinia. These results emphasize that the geographic history of a Y-chromosome haplotype can be complex, and modern day spatial distributions need not reflect the initial spread.
The abstract and paper are as follows:
The transitions from foraging to farming and later to pastoralism in Stone Age Eurasia (c. 11-3 thousand years before present, BP) represent some of the most dramatic lifestyle changes in human evolution. We sequenced 317 genomes of primarily Mesolithic and Neolithic individuals from across Eurasia combined with radiocarbon dates, stable isotope data, and pollen records.
Genome imputation and co-analysis with previously published shotgun sequencing data resulted in >1600 complete ancient genome sequences offering fine-grained resolution into the Stone Age populations.
We observe that:
1) Hunter-gatherer groups were more genetically diverse than previously known, and deeply divergent between western and eastern Eurasia.
2) We identify hitherto genetically undescribed hunter-gatherers from the Middle Don region that contributed ancestry to the later Yamnaya steppe pastoralists;
3) The genetic impact of the Neolithic transition was highly distinct, east and west of a boundary zone extending from the Black Sea to the Baltic. Large-scale shifts in genetic ancestry occurred to the west of this "Great Divide", including an almost complete replacement of hunter-gatherers in Denmark, while no substantial ancestry shifts took place during the same period to the east. This difference is also reflected in genetic relatedness within the populations, decreasing substantially in the west but not in the east where it remained high until c. 4,000 BP;
4) The second major genetic transformation around 5,000 BP happened at a much faster pace with Steppe-related ancestry reaching most parts of Europe within 1,000-years. Local Neolithic farmers admixed with incoming pastoralists in eastern, western, and southern Europe whereas Scandinavia experienced another near-complete population replacement. Similar dramatic turnover-patterns are evident in western Siberia;
5) Extensive regional differences in the ancestry components involved in these early events remain visible to this day, even within countries. Neolithic farmer ancestry is highest in southern and eastern England while Steppe-related ancestry is highest in the Celtic populations of Scotland, Wales, and Cornwall (this research has been conducted using the UK Biobank resource);
6) Shifts in diet, lifestyle and environment introduced new selection pressures involving at least 21 genomic regions. Most such variants were not universally selected across populations but were only advantageous in particular ancestral backgrounds. Contrary to previous claims, we find that selection on the FADS regions, associated with fatty acid metabolism, began before the Neolithisation of Europe. Similarly, the lactase persistence allele started increasing in frequency before the expansion of Steppe-related groups into Europe and has continued to increase up to the present. Along the genetic cline separating Mesolithic hunter-gatherers from Neolithic farmers, we find significant correlations with trait associations related to skin disorders, diet and lifestyle and mental health status, suggesting marked phenotypic differences between these groups with very different lifestyles.
This work provides new insights into major transformations in recent human evolution, elucidating the complex interplay between selection and admixture that shaped patterns of genetic variation in modern populations.
Population Replacement in Northern Asia Around The Last Glacial Maximum
A paper in the journal Cell that I missed when it was released a year ago, discussed at the magazine Science, analyzes 25 new ancient DNA samples from Russia's Amur region and compares them to existing ancient DNA samples and modern DNA samples in the region.
The paper finds that there was complete population replacement between the pre-Last Glacial Maximum population of Northeast Asia and the modern one ancestral to the current indigenous people of the Amur region that emerged around 19,000 years ago. This population is more closely related to modern East Asians and Native Americans, than to the pre-LGM people of Northeast Asia whose ancient DNA in available.
These Northern East Asians split about 19,000 years ago from Southern East Asians.
The paper's abstract and citation are as follows:
Northern East Asia was inhabited by modern humans as early as 40 thousand years ago (ka), as demonstrated by the Tianyuan individual. Using genome-wide data obtained from 25 individuals dated to 33.6–3.4 ka from the Amur region, we show that Tianyuan-related ancestry was widespread in northern East Asia before the Last Glacial Maximum (LGM).
At the close of the LGM stadial, the earliest northern East Asian appeared in the Amur region, and this population is basal to ancient northern East Asians. Human populations in the Amur region have maintained genetic continuity from 14 ka, and these early inhabitants represent the closest East Asian source known for Ancient Paleo-Siberians.
We also observed that EDAR V370A was likely to have been elevated to high frequency after the LGM, suggesting the possible timing for its selection. This study provides a deep look into the population dynamics of northern East Asia.
Friday, April 29, 2022
Tau g-2 Crudely Measured
Muon g-2 has been measured to better than parts per million precision and compared to highly precise Standard Model predictions. The differences between the two main Standard Model predictions and the experimental measurements of this physical observable (the anomalous magnetic moment of the muon) are at the parts per ten million level although the differences between the two main Standard Model predictions, and between the experimentally measured value and one of those predictions, is statistically significant.
The tau lepton's anomalous magnetic moment has a quite precise (but not quite as precise as muon g-2) Standard Model predicted value of the SM prediction of 0.001 177 21 (5), which is quite close to the quite precisely measured and theoretically calculated electron g-2 value (the experimentally measured value of which is in mild 2.5 sigma tension with this value measured at a parts per hundred million level, by being too low), and the muon g-2 value (discussed at length in previous posts at this blog which is in tension with the Standard Model value in the other direction).
Thursday, April 28, 2022
Seventh Higgs Boson Decay Channel Confirmed
Numerically, the decays of a 125 GeV Higgs boson in the Standard Model (which is a little below the experimentally measured value) are approximately as follows (updated per a PDG review paper with details of the calculations, for example, here and here):
A new paper from the CMS experiment at the Large Hadron Collider (LHC) detects a seventh Higgs boson decay channel predicted in the Standard Model, a decay to a Z boson and a photon, although not yet at the five sigma "discovery" level of significance.
The signal strength μ, defined as the product of the cross section and the branching fraction [σ(pp→H)B(H→Zγ)] relative to the standard model prediction, is extracted from a simultaneous fit to the ℓ+ℓ−γ invariant mass distributions in all categories and is found to be μ=2.4±0.9 for a Higgs boson mass of 125.38 GeV. The statistical significance of the observed excess of events is 2.7 standard deviations. This measurement corresponds to σ(pp→H)B(H→Zγ) = 0.21±0.08 pb.
The observed (expected) upper limit at 95% confidence level on μ is 4.1 (1.8). The ratio of branching fractions B(H→Zγ)/B(H→γγ) is measured to be 1.5+0.7−0.6, which agrees with the standard model prediction of 0.69 ± 0.04 at the 1.5 standard deviation level.
How Far Is Earth From The Center Of The Milky Way Galaxy?
The planet Earth is 26,800 ± 391 light years (i.e. ± 1.5%) from the center of the Milky Way galaxy.
The distance to the Galactic center R(0) is a fundamental parameter for understanding the Milky Way, because all observations of our Galaxy are made from our heliocentric reference point. The uncertainty in R(0) limits our knowledge of many aspects of the Milky Way, including its total mass and the relative mass of its major components, and any orbital parameters of stars employed in chemo-dynamical analyses.
While measurements of R(0) have been improving over a century, measurements in the past few years from a variety of methods still find a wide range of R(0) being somewhere within 8.0 to 8.5 kpc. The most precise measurements to date have to assume that Sgr A∗ is at rest at the Galactic center, which may not be the case.
In this paper, we use maps of the kinematics of stars in the Galactic bar derived from APOGEE DR17 and Gaia EDR3 data augmented with spectro-photometric distances from the astroNN neural-network method. These maps clearly display the minimum in the rotational velocity vT and the quadrupolar signature in radial velocity vR expected for stars orbiting in a bar. From the minimum in vT, we measure R(0) = 8.23 ± 0.12 kpc. We validate our measurement using realistic N-body simulations of the Milky Way.
We further measure the pattern speed of the bar to be Ω(bar)=40.08±1.78kms^−1kpc^−1. Because the bar forms out of the disk, its center is manifestly the barycenter of the bar+disc system and our measurement is therefore the most robust and accurate measurement of R(0) to date.
Evidence Of Medieval Era Viking Trade Of North American Goods
There is a lot of basically irrefutable evidence that Vikings had settlements in Pre-Columbian North America starting around 1000 CE, and that they made return trips to Iceland and more generally, to Europe.
There are ruins of a settlement in Vinland, and there is another such settlement in Eastern Canada as well.
There are people in Iceland with Native American mtDNA that can traced back genealogically, using Iceland's excellent genealogy records, to a single woman in the right time frame.
There are legendary history attestations of the trips in written Viking accounts from the right time period.
Now, there is a Walrus ivory trinket that made its was to Kyiv (a.k.a. Kiev) in the Middle Ages which has been identified by a recent paper as coming from a Greenland Walrus. The paper and its abstract are as follows:
Mediaeval walrus hunting in Iceland and Greenland—driven by Western European demand for ivory and walrus hide ropes—has been identified as an important pre-modern example of ecological globalization. By contrast, the main origin of walrus ivory destined for eastern European markets, and then onward trade to Asia, is assumed to have been Arctic Russia.
Here, we investigate the geographical origin of nine twelfth-century CE walrus specimens discovered in Kyiv, Ukraine—combining archaeological typology (based on chaîne opératoire assessment), ancient DNA (aDNA) and stable isotope analysis. We show that five of seven specimens tested using aDNA can be genetically assigned to a western Greenland origin. Moreover, six of the Kyiv rostra had been sculpted in a way typical of Greenlandic imports to Western Europe, and seven are tentatively consistent with a Greenland origin based on stable isotope analysis. Our results suggest that demand for the products of Norse Greenland's walrus hunt stretched not only to Western Europe but included Ukraine and, by implication given linked trade routes, also Russia, Byzantium and Asia. These observations illuminate the surprising scale of mediaeval ecological globalization and help explain the pressure this process exerted on distant wildlife populations and those who harvested them.
Tuesday, April 26, 2022
Twenty-Two Reasons That The Standard Model Is Basically Complete (Except For Gravity)
The Assertion
I strongly suspect that the Standard Model of Particle Physics is complete (except for gravity), by which I mean that it describes all fundamental particles (i.e. non-composite particles) other than possibly a massless spin-2 graviton, and all forces (other than gravity), and that the equations of the three Standard Model forces are basically sound.
I likewise strongly suspect that the running of the experimentally measured constants of the Standard Model with energy scale, according to their Standard Model beta functions, is basically correct, although these beta functions may require slight modification (that could add up to something significant at very high energies) to account for gravity.
This said, I do not rule out the possibility that some deeper theory explains everything in the Standard Model more parsimoniously, or that there are additional laws of nature that while not contradicting the Standard Model, further constrain it. Also, I recognize that neutrino mass is not yet well understood (but strongly suspect that neither a see-saw mechanism, nor Majorana neutrinos, are the correct explanation).
There are some global tests of the Standard Model and other kinds of reasoning that suggest this result. Twenty-two such reasons are set forth below.
Reasoning Up To Future Collider Energy Scales
1. Experimentally measured W and Z boson decay branching fractions are a tight match to Standard Model theoretically prediction. This rules out the existence of particles that interact via the weak force with a mass of less than half of the Z boson mass (i.e. of less than 45.59 GeV).
2. The consistency of the CKM matrix entries measured experimentally with a three generation model likewise supports the completeness of the set of six quarks in the Standard Model. If there were four or more generations, the probabilities of quark type transitions from any given quark wouldn't add up to 100%.
3. The branching fractions of decaying Higgs bosons are a close enough match to the Standard Model theoretical prediction that new particles that derive their mass from the Higgs boson with a mass more than about 1 GeV and less than about half of the Higgs boson mass (i.e. about 62.6 GeV) would dramatically alter these branching fractions. The close match of the observed and Standard Model Higgs boson also disfavors the composite Higgs bosons of technicolor theories.
4. The muon g-2 measurement is consistent with the BLM calculation of the Standard Model expectation for muon g-2 and I strongly suspect that the BLM calculation is more sound than the other leading calculation of that value. If the BLM calculation is sound, then that means that nothing that makes a loop contribution to muon g-2 (which is again a global measurement of the Standard Model) that does not perfectly cancel out in the muon g-2 calculation has been omitted. The value of muon g-2 is most sensitive to new low mass particles, with the loop effects of high mass particles becoming so small that they effective decouple from the muon g-2 calculation. But this does disfavor new low mass particles in a manner that makes the exclusion from W and Z boson decays more robust.
5. The Standard Model mathematically requires each generation of fermions to contain an up-type quark (excluded below 1350 GeV), a down-type quark (excluded below 1530 GeV), a charged lepton (excluded below 100.8 GeV), and a neutrino. Searches have put lower bounds on the masses of new up-type quarks, down-type quarks, and charged leptons, but the most powerful constraint is that there can't be a new active neutrino with a mass of less than 45.59 GeV based upon Z boson decays. Yet, there is observational evidence constraining the sum of all three of the neutrino mass eigenstates to be less than about 0.1 eV and there is no plausible reason for there to be an immense gap in neutrino masses between the first three and a fourth generation neutrino mass. There are also direct experimental search exclusions for particles predicted by supersymmetry theories and other simple Standard Model extensions such as new heavy neutral Higgs bosons (with either even or odd parity) below 1496 GeV, exclusions for new charged Higgs bosons below 1103 GeV, W' bosons below 6000 GeV, Z' bosons below 5100 GeV, stable supersymmetric particles below 46 GeV, unstable supersymmetric neutralinos below 380 GeV, unstable supersymmetric charginos below 94 GeV, R-parity conserving sleptinos below 82 GeV, supersymmetric squarks below 1190 GeV, and supersymmetric gluinos below 2000 GeV. There are also strong experimental exclusions of simple composite quark and composite lepton models (generally below 2.3 TeV for some cases and up to 24 TeV in others) and similar scale experimental exclusions of evidence for extra dimensions that are relevant to collider physics.
6. In the Standard Model, fermions decay into lighter fermions exclusively via W boson interactions, and the mean lifetime of a particle in the Standard Model is something that can be calculated. So, it ought to be impossible for any fermion to decay faster than the W boson does. But, the top quark decays just 60% slower than the W boson, and any particle that can decay via W boson interactions that is more massive than mass range for new Standard Model type fermions that has not been experimentally excluded should have a mean lifetime shorter than the W boson.
7. Overall, the available data on neutrino oscillations, taken as a whole, disfavors the existence of a "sterile neutrino" that oscillates with the three active Standard Model neutrinos.
8. It is possible to describe neutrino oscillation as a W boson mediated process without resort to a new boson to govern neutrino oscillation.
9. There are good explanations for the lack of CP violation in the strong force that do not require the introduction of an axion or another new particle. One of the heuristically more pleasing of these explanations is that gluons are massless and hence do not experience the passage of time and hence should not be time asymmetric (which CP violation implies).
10. Collider experiments, moreover, have experimentally tested the Standard Model at energies up to those present a mere fraction of a second after the Big Bang (by conventional cosmology chronologies). Other than evidence for lepton universality violations, there are no observations which new particles or forces are clearly necessary to explain at colliders with new physics.
11. I predict that lepton universality violations observed in semi-leptonic B meson decays, but nowhere else, will turn out to be due to a systemic error, most likely, in my view, a failure of energy scale cutoffs that were designed to exclude electrons produced in pion decays to be excluded as expected. To a great extent, in addition to a general Standard Model correctness Bayesian prior, this is also due to the fact that semi-leptonic B meson decays in the Standard Model are a W boson mediated process indistinguishable from many other W boson mediated processes in which lepton universality is preserved.
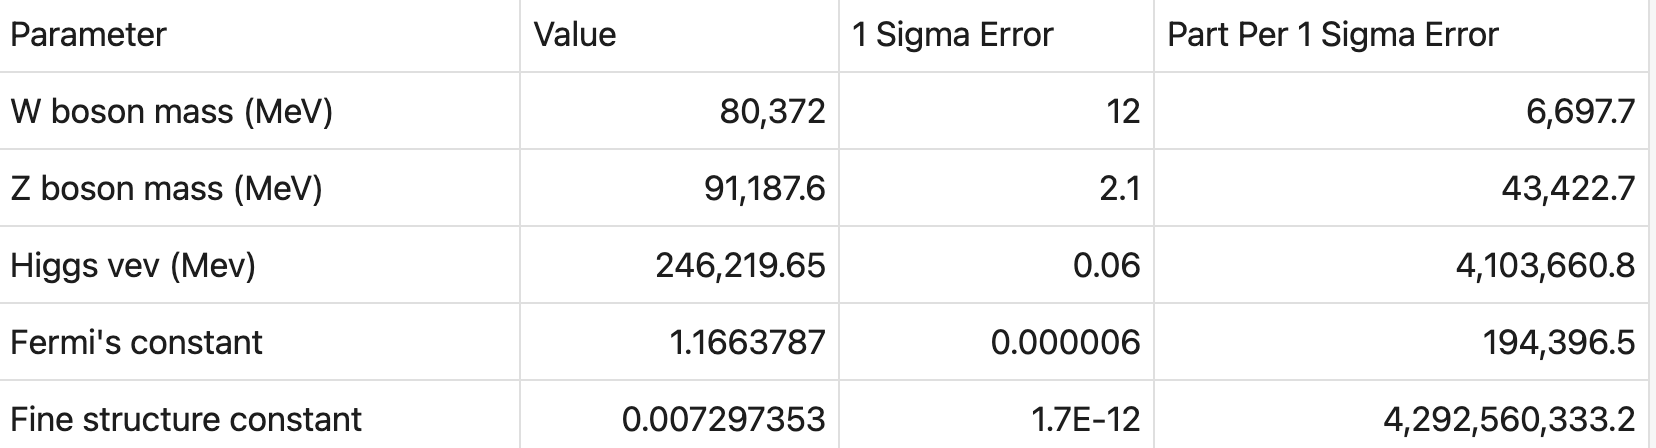
12. The consistency of the LP&C relationship (i.e. that the sum of the square of the masses of the fundamental particles of the Standard Model is equal to the square of the Higgs vacuum expectation value) with experimental data to the limits of experimental accuracy (with most of the uncertainty arising from uncertainty in the measurements of the top quark mass and the Higgs boson mass), suggests that this is a previously unarticulated rule of electroweak physics and that there are no fairly massive (e.g. GeV scale) fundamental fermions or bosons omitted from the Standard Model. Uncertainties in the top quark mass and Higgs boson mass, however, are sufficient large that this does not rule out very light new fundamental particles (which can be disfavored by other means noted above, however). The LP & C relationship, if true, also makes the "hierarchy problem" and the "naturalness" problem of the Standard Model, that supersymmetry was devised to address, non-existent.
13. I suspect that the current Standard Model explanation for quark, charged lepton, W boson, Z boson and Higgs boson masses, which is based upon a coupling to the Higgs boson understates the rule played by the W boson in establishing fundamental particle masses underscored by the fact that all massive fundamental particles have weak force interactions and all massless fundamental particles do not have weak force interactions, and by cryptic correlations between the CKM and PMNS matrixes which are properties of W boson mediated events, and the fundamental particle masses. A W boson centric view of fundamental particle mass is attractive, in part, because it overcomes theoretical issues associated with Standard Model neutrinos having Dirac mass in a Higgs boson centric view.
Astronomy and Cosmology Motivated Reasons
14. The success of Big Bang nucleosynthesis supports that idea that no new physics is required, and that many forms of new physics are ruled out, up to energy scales conventionally placed at ten seconds after the Big Bang and beyond.
15. The Standard Model is mathematically sound and at least metastable at energy scales up to the GUT scale without modification. So, new physics are not required at high energies. Consideration of gravity when determining the running of the Standard Model physical constants to high energies may even take the Standard Model from merely being metastable to being just barely stable at the GUT scale. The time that would elapse from the Big Bang t=0 to GUT or Planck energies at which the Standard Model may be at least metastable is brief indeed and approaches the unknowable. Apart from this exceeding small fraction of a second, energies above this level don't exist in the universe and new physics above this scale essentially at the very moment of the Big Bang could explain its existence.
16. Outside the collider context, dark matter phenomena, dark energy phenomena, cosmological inflation, and matter-antimatter asymmetry, are the only observations that might require new physics to explain.
17. A beyond the Standard Model particle to constitute dark matter is not necessary because dark matter can be explained, and is better explained, as a gravitational effect not considered in General Relativity as applied in the Newtonian limit in astronomy and cosmology settings. There are several gravitational approaches that can explain dark matter phenomena.
18. There are deep, general, and generic problems involved in trying to reconcile observations to collisionless dark matter particle explanations, some of which are shared by more complex dark matter particle theories like self-interacting dark matter, and as one makes the dark matter particle approach more complex, Occam's Razor disfavors it relative to gravitational approaches.
19. Direct dark matter detection experiments have ruled out dark matter particles even with cross-sections of interaction with ordinary matter much weaker than the cross-section of interaction with a neutrino for masses from somewhat less than 1 GeV to 1000 GeV, and other evidence from galaxy dynamics strongly disfavors truly collisionless dark matter that interacts only via gravity. This limitation, together with collider exclusions, in particular, basically rule out supersymmetric dark matter candidates which are no longer theoretically well motivated.
20. Consideration of the self-interaction of gravitational fields in classical General Relativity itself (without a cosmological constant), can explain the phenomena attributed to dark matter and dark energy without resort to new particles, new fields, or new forces, and without the necessity of violating the conservation of mass-energy as a cosmological constant or dark energy do. The soundness of this analysis is supported by analogy to mathematically similar phenomena in QCD that are well tested. Explaining dark energy phenomena with the self-interaction of gravitational fields removing the need for a cosmological constant also makes developing a quantum theory of gravity fully consistent in the classical limit with General Relativity and consistent with the Standard Model much easier. There are also other gravity based approaches to explain dark energy (and indeed the LambdaCDM Standard Model of Cosmology uses the gravity based approach of General Relativity with a cosmological constant to explain dark energy phenomena).
21. The evidence for cosmological inflation is weak even in the current paradigm, and it is entirely possible and plausible that a gravitational solution to the phenomena attributed to dark matter and dark energy arising from the self-interaction of gravitational fields, when fully studied and applied to the phenomena considered to be evidence of cosmological inflation will show that cosmological inflation is not necessary to explain those phenomena.
22. There are plausible explanations of the matter-antimatter imbalance in baryons and charged leptons that is observed in the universe that do not require new post-Big Bang physics. In my view, the most plausible of these is the possibility that there exists an antimatter dominated mirror universe of ours "before" the Big Bang temporally in which time runs in the opposite direction, consistent with the notion of antimatter as matter moving backward in time and with time flowing from low entropy to high entropy. So, no process exhibiting extreme CP asymmetry (and baryon and lepton number violation) and limited to ultra-high energies present in the narrow fraction of a second after the Big Bang that has not been explored experimentally is necessary.
Monday, April 25, 2022
Neolithic Ancient DNA In Normandy Fit Paradigm
Looking For Cryptids in Flores
My aim in writing the book was to find the best explanation—that is, the most rational and empirically best supported—of Lio accounts of the creatures. These include reports of sightings by more than 30 eyewitnesses, all of whom I spoke with directly. And I conclude that the best way to explain what they told me is that a non-sapiens hominin has survived on Flores to the present or very recent times.Between Ape and Human also considers general questions, including how natural scientists construct knowledge about living things. One issue is the relative value of various sources of information about creatures, including animals undocumented or yet to be documented in the scientific literature, and especially information provided by traditionally non-literate and technologically simple communities such as the Lio—a people who, 40 or 50 years ago, anthropologists would have called primitive. To be sure, the Lio don’t have anything akin to modern evolutionary theory, with speciation driven by mutation and natural selection. But if evolutionism is fundamentally concerned with how different species arose and how differences are maintained, then Lio people and other Flores islanders have for a long time been asking the same questions.
Monday, April 18, 2022
Everything You Ever Wanted To Know About Ditauonium
Ditauonium is a hydrogen atom-like bound state of a tau lepton and an anti-tau lepton, which can come in para- or ortho- varieties depending upon their relative spins. Its properties can be calculated to high precision using quantum electrodynamics and to a lesser extent other Standard Model physics considerations. Its properties are as follows, according to a new paper analyzing the question and doing the calculations:
Thursday, April 14, 2022
Monday, April 11, 2022
Pluto's Orbit Is Metastable
A new paper examining some unusual features of Pluto's orbit concludes that the gas giant planets interact in a complex manner to produce its orbit. Two of them stabilize that orbit, while one of them destabilizes it.
"Neptune account for the azimuthal constraint on Pluto's perihelion location," and "Jupiter has a largely stabilizing influence whereas Uranus has a largely destabilizing influence on Pluto's orbit. Overall, Pluto's orbit is rather surprisingly close to a zone of strong chaos."
Evaluating Dark Matter And Modified Gravity Models
A less model dependent approach to comparing dark matter and modified gravity theories to the galaxy data, which is complementary to the Radial Acceleration Relation (RAR), which is dubbed Normalized Additional Velocity (NAV) is presented in a new paper and compared to the SPARC database.
This method looks at the gap between the Newtonian gravitational expectation and the observed rotation curves of rotationally supported galaxies.
I'll review the five theories tested in the paper.
The Burkert profile (sometimes described as "pseudo-isothermal" and first proposed in 1995) is used to represent particle dark matter in a trial run of this method is a basically phenomenological distribution of dark matter particles in a halo (i.e. it was not devised to flow naturally from the plausible properties of a particular dark matter candidate), unlike the Navarro-Frank-White profile for dark matter particle halos which flows directly from a collisionless dark matter particle theory from first principles, but is a poor fit to the inferred dark matter halos that are observed. The Burkert profile has two free parameters that are set on a galaxy by galaxy basis: the core radius r0 and the central density ρ0. It systemically favors rotational velocities too high a small radii and too low a large radii, however.
MOND is familiar to readers of this blog, was proposed in 1983, is a very simple tweak of Newtonian gravity, and is purely phenomenological toy model (that doesn't have a particularly obvious relativistic generalization), but has been a good match to the data in galaxy sized and smaller systems. There are a variety of more theoretically deep gravity based explanations of dark matter phenomena out there, but this is the most widely known, is one of the oldest, and has a good track record in its domain of applicability. It has one universal constant, a(0), with units of acceleration beyond Newtonian gravity. MOND shows less dispersion in NAV than the data set does, although it isn't clear how much this is due to uncertainties in the data, as opposed to shortcomings in the theory.
The Palatini f(R) gravity and Eddington-inspired-Born-Infeld (EiBI) are theories that modify General Relativity in ways that tweak add and/or modify Einstein's field equations in ways that make plausible hypotheses to adjust them in a theoretically consistent manner and do lead to some explanation of dark matter phenomena, but very well, as this paper notes. Palatini f(R) gravity replaces the Ricci tensor and scalar with a function that has higher order terms not present in Einstein's field equations. The Eddington-inspired-Born-Infeld theory starts with the "Lagrangian of GR, with an effective cosmological constant Λ = 𝜆−1 𝜖 , and with additional added quadratic curvature corrections. Essentially, it is a particular 𝑓 (𝑅) case that fits the Palatini 𝑓 (𝑅) case that was presented in the previous section, together with a squared Ricci tensor term[.]"
General relativity with renormalization group effects (RGGR) is based on a GR correction due to the scale-dependent 𝐺 and Λ couplings, and has one free parameter that varies from galaxy to galaxy that is absent in MOND. It outperforms Burkert and MOND predictions at smaller galactic radii and in the middle of the probability distribution of NAV measurements, but somewhat overstates modification of gravity at large radii at the extremes of the probability distributions.
Also, while the Burkert profile with two fitting constants, outperforms RGGR with one, and MOND with none, once you penalize that theory for the extra degrees of freedom it has to fit the data, the grounds to prefer one model over another is significantly weaker. Some of the galaxy specific fitting may simply be mitigating galaxy specific measurement errors.
Here we propose a fast and complementary approach to study galaxy rotation curves directly from the sample data, instead of first performing individual rotation curve fits. The method is based on a dimensionless difference between the observational rotation curve and the expected one from the baryonic matter (δV^2). It is named as Normalized Additional Velocity (NAV). Using 153 galaxies from the SPARC galaxy sample, we find the observational distribution of δV^2. This result is used to compare with the model-inferred distributions of the same quantity.
We consider the following five models to illustrate the method, which include a dark matter model and four modified gravity models: Burkert profile, MOND, Palatini f(R) gravity, Eddington-inspired-Born-Infeld (EiBI) and general relativity with renormalization group effects (RGGR).
We find that the Burkert profile, MOND and RGGR have reasonable agreement with the observational data, the Burkert profile being the best model. The method also singles out specific difficulties of each one of these models. Such indications can be useful for future phenomenological improvements.
The NAV method is sufficient to indicate that Palatini f(R) and EiBI gravities cannot be used to replace dark matter in galaxies, since their results are in strong tension with the observational data sample.
Alejandro Hernandez-Arboleda, Davi C. Rodrigues, Aneta Wojnar, "Normalized additional velocity distribution: a fast sample analysis for dark matter or modified gravity models" arXiv:2204.03762 (April 7, 2022).
Here we propose a fast and complementary approach to study galaxy rotation curves directly from the sample data, instead of first performing individual rotation curve fits. The method is based on a dimensionless difference between the observational rotation curve and the expected one from the baryonic matter (δV^2). It is named as Normalized Additional Velocity (NAV). Using 153 galaxies from the SPARC galaxy sample, we find the observational distribution of δV^2. This result is used to compare with the model-inferred distributions of the same quantity.
We consider the following five models to illustrate the method, which include a dark matter model and four modified gravity models: Burkert profile, MOND, Palatini f(R) gravity, Eddington-inspired-Born-Infeld (EiBI) and general relativity with renormalization group effects (RGGR).
We find that the Burkert profile, MOND and RGGR have reasonable agreement with the observational data, the Burkert profile being the best model. The method also singles out specific difficulties of each one of these models. Such indications can be useful for future phenomenological improvements.
The NAV method is sufficient to indicate that Palatini f(R) and EiBI gravities cannot be used to replace dark matter in galaxies, since their results are in strong tension with the observational data sample.
Friday, April 8, 2022
A New W Boson Mass Measurement From CDF
This result uses the entire dataset collected from the Tevatron collider at Fermilab. It is based on the observation of 4.2 million W boson candidates, about four times the number used in the analysis the collaboration published in 2012.
91,192.0 ± 6.4 stat ± 4.0 syst MeV [ed. combined error 7.5 MeV] (stat, statistical uncertainty; syst, systematic uncertainty), which is consistent with the world average of 91,187.6 ± 2.1 MeV.
The main problem . . . is that the new measurement is in disagreement with all other available measurements. I think this could have been presented better in their paper, mainly because the measurements of the LEP experiments have not been combined, secondly because they don't show the latest result from LHCb. Hence I created a new plot (below), which allows for a more fair judgement of the situation. I also made a back-of-envelope combination of all measurements except of CDF, yielding a value of 80371 ± 14 MeV. It should be pointed out that all these combined measurements rely partly on different methodologies as well as partly on different model uncertainties. The likelihood of the consistency of such a (simple) combination is 0.93. Depending (a bit) on the correlations you assume, this value has a discrepancy of about 4 sigma to the CDF value.In fact, there are certainly some aspects of the measurement which need to be discussed in more detail (Sorry, now follow some technical aspects, which most likely only people from the field can fully understand): In the context of the LHC Electroweak Working Group, there are ongoing efforts to correctly combine all measurements of the W boson mass; in contrast to what I did above, this is in fact also a complicated business, if you want to do it really statistically sound. My colleague and friend Maarten Boonekamp pointed out in a recent presentation, that the Resbos generator (which was used by CDF) has potentially some problems when describing the spin-correlations in the W boson production in hadron collisions. In fact, there are remarkable changes in the predicted relevant spectra between the Resbos program and the new version of the program Resbos2 (and other generators) as seen in the plot below. On first sight, the differences might be small, but you should keep in mind, that these distributions are super sensitive to the W boson mass. I also attached a small PR plot from our last paper, which indicates the changes in those distributions when we change the W boson mass by 50 MeV, i.e. more than ten times than the uncertainty which is stated by CDF. I really don't want to say that this effect was not yet considered by CDF - most likely it was already fixed since my colleagues from CDF are very experienced physicists, who know what they do and it was just not detailed in the paper. I just want to make clear that there are many things to be discussed now within the community to investigate the cause of the tension between measurements.
Difference in the transverse mass spectrum between Resbos and Resbos2 (left); impact of different W boson mass values on the shapes of transverse mass.And this brings me to another point, which I consider crucial: I must admit that I am quite disappointed that it was directly submitted to a journal, before uploading the results on a preprint server. We live in 2022 and I think it is by now good practice to do so, simply because the community could discuss these results beforehand - this allows a scientific scrutiny from many scientists which are directly working on similar topics.
More commentary from Matt Strassler is available at his blog (also here). The money quote is this one (emphasis in the original, paragraph breaks inserted editorially for ease of reading):
A natural and persistent question has been:
“How likely do you think it is that this W boson mass result is wrong?”
Obviously I can’t put a number on it, but I’d say the chance that it’s wrong is substantial.
Why?
This measurement, which took several many years of work, is probably among the most difficult ever performed in particle physics. Only first-rate physicists with complete dedication to the task could attempt it, carry it out, convince their many colleagues on the CDF experiment that they’d done it right, and get it through external peer review into Science magazine. But even first-rate physicists can get a measurement like this one wrong. The tiniest of subtle mistakes will undo it.
Physicist Tommaso Dorigo chimes in at his blog and he is firmly in the camp of measurement error and identifies some particularly notable technical issues that could cause the CDF number to be too high.
I already answered the question of whether in my opinion the new CDF measurement of the W boson mass, standing at seven standard deviations away from the predictions of the Standard Model, is a nail in the SM coffin. Now I will elaborate a little on part of the reasons why I have that conviction. I cannot completely spill my guts on the topic here though, as it would take too long - the discussion involves a number of factors that are heterogeneous and distant from the measurement we are discussing. Instead, let us look at the CDF result.One thing I noticed is that the result with muons is higher than the result with electrons. This may be a fluctuation, of course (the two results are compatible within quoted uncertainties), but if for one second we neglected the muon result, we would get a much better agreement with theory: the electron W mass is measured to 80424.6+-13.2 MeV, which is some 4.5 sigmaish away from theory prediction of 80357+-6 MeV. Still quite a significant departure, but not yet an effect of unheard-of size for accidentals.Then, another thing I notice is that CDF relied on a custom simulation for much of the phenomena involving the interaction of electrons and muons with the detector. That by itself is great work, but one wonders why not using the good old GEANT4 that all of us know and love for that purpose. It's not like they needed a fast simulation - they had the time!A third thing I notice is that the knowledge of backgrounds accounts for a significant systematic effect - it is estimated in the paper as accounting for a potential shift of two to four MeV (but is that sampled from a Gaussian distribution or can there be fatter tails?). In fact, there is one nasty background that arises in the data when you have a decay of a Z to a pair of muons, and one muon gets lost for some reconstruction issue or by failing some quality criteria. The event, in that case, appears to be a genuine W boson decay: you see a muon, and the lack of a second leg causes an imbalance in transverse momentum that can be interpreted as the neutrino from W decay. This "one-legged-Z" background is of course accounted for in the analysis, but if it had been underestimated by even only a little bit, this would drive the W mass estimate up, as the Z has a mass larger than the W (so its muons are more energetic).Connected to that note is the fact that CDF does show how their result can potentially shift significantly in the muon channel if they change the range of fitted transverse masses - something which you would indeed observe if you had underestimated the one-legged Z's in your data. This is shown in the two graphs below, where you see that the fitted result moves down by quite a few MeV if you change the upper and lower boundaries:A fourth thing I notice is that the precision of the momentum scale determination, driven by studies of low-energy resonances (J/psi and Upsilon decays to muon pairs) is outstanding, but the graph that CDF shows to demonstrate it is a bit suspicious to my eyes - it is supposed to demonstrate a flat response as a function of inverse momentum, but to my eyes it in fact shows the opposite. Here is what I am talking about:
I took the liberty to take those data points and fit them with a different assumption - not a constant, but a linear slope, and not the full spectrum, but only up to inverse momenta of 0.3; and here is what I get:Of course, nobody knows what the true model of the fitting function should be; but a Fisher F test would certainly prefer my slope fit to a constant fit. Yes, I have neglected the points above 0.3, but who on earth can tell me that all these points should line up in the same slope? So, what I conclude from my childish exercise is that the CDF calibration data points are not incompatible (but IMHO better compatible) with a slope of (-0.45+-0.1)*10^-3 GeV.What that may mean, given that they take the calibration to be -1.4 from a constant fit, is to get the scale wrong by about a part in ten thousand at the momentum values of relevance for the W mass measurement in the muon channel. This is an effect of about 8 MeV, which I do not see accounted for in the list of systematics that CDF produced. [One caveat is that I have no idea whether the data points have correlated uncertainties among the uncertainty bars shown, which would invalidate my quick-and-dirty fit result.]I could go on with other things I notice, and you clearly see we would not gain much. My assessment is that while this is a tremendously precise result, it is also tremendously ambitious. Taming systematic uncertainties down to effects of a part in ten thousand or less, for a subnuclear physics measurement, is a bit too much for my taste. What I am trying to say is that while we understand a great deal about elementary particles and their interaction with our detection apparatus, there is still a whole lot we don't fully understand, and many things we are assuming when we extract our measurements. . . .
I can also say that the CDF measurement is slamming a glove of challenge on ATLAS and CMS faces. Why, they are sitting on over 20 times as much data as CDF was able to analyze, and have detectors built with a technology that is 20 years more advanced than that of CDF - and their W mass measurements are either over two times less precise (!!, the case of ATLAS), or still missing in action (CMS)? I can't tell for sure, but I bet there are heated discussions going on at the upper floors of those experiments as we speak, because this is too big a spoonful of humble pie to take on.
He also reminds us of the fact that real world uncertainties don't have a Gaussian (i.e. "normal") distribution and instead have "fat tails" with extreme deviations from expected values being more common than expected in a Gaussian distribution.
Likewise physicist Sabine Hossenfelder tweets:
Could this mean the standard model is wrong? Yes. But more likely it's a problem with their data analysis. Fwiw, I don't think this is a case for theorists at all. Theorists will explain whatever data you throw at them.
Footnote Regarding Definitional Issues